Modern Blue Pie Chart Template – Market Share Analysis
RJ0200035_9
- Last Update 04/08/2025
- File Size 0.7MB
- # of Slides 2
- File Format PPTX
- Slide Ratio 16:9
- Color
Keywords
About the Product
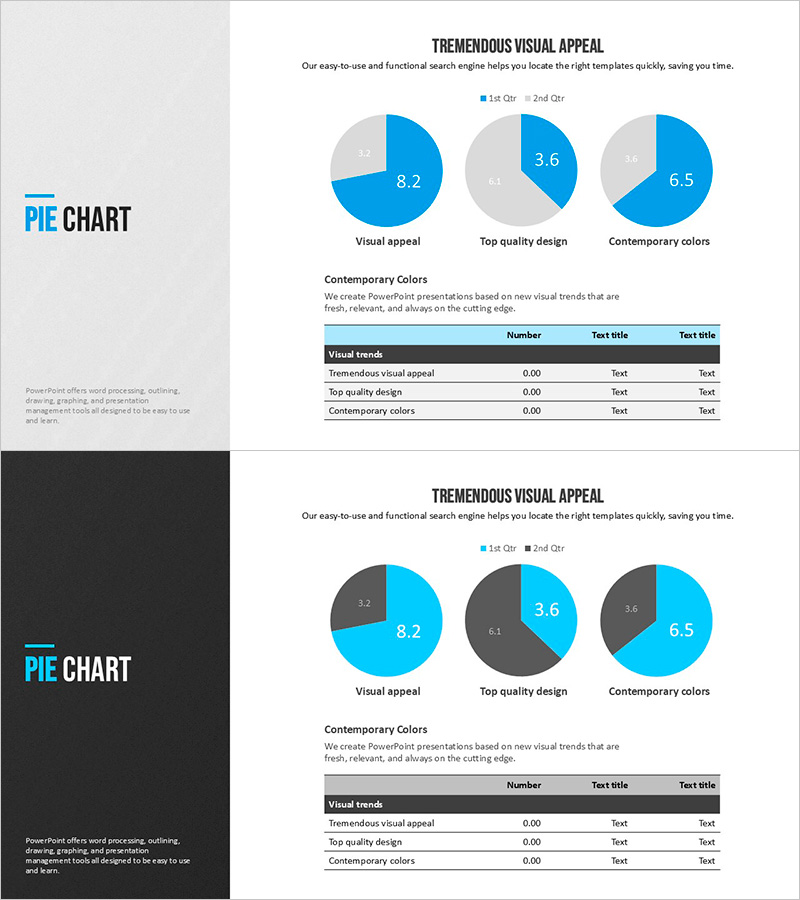
A professional pie chart PowerPoint slide designed to compare market share, revenue composition, and customer distribution at a glance. The template uses bright blue tones for primary data and gray for secondary data, creating clear visual hierarchy and directing audience focus. The 2-slide set includes a 3-segment pie chart on the first slide and a 2-segment comparison format on the second, accommodating various analytical scenarios. Optimized for 16:9 widescreen displays with numeric labels and legend for precise data communication. Ready to use in business presentations, quarterly reports, marketing plans, and strategic briefings.
Usage Points
-
Main Usage
Visualize proportional relationships such as market share, revenue breakdown, customer segments, and budget allocation. The blue-emphasized primary data and gray secondary data create immediate visual distinction, while numeric labels ensure accurate quantitative comparison and clear information hierarchy.
-
How to Use
Slide 1 displays a 3-segment pie chart; Slide 2 shows a 2-segment comparison format. Edit the legend and data labels to input your analysis content, and adjust colors to match corporate branding guidelines. The 16:9 widescreen format is optimized for large-screen presentations and conference displays.
-
Recommended For
Marketing professionals presenting market analysis, executives delivering business reports, finance teams explaining budget status, sales teams analyzing customer composition, and strategy planners introducing business portfolios. Ideal for quarterly and annual performance reviews, investor presentations, and competitive analysis briefings.
-
Slide Structure
2-slide set: Slide 1 features a 3-segment pie chart with one blue-emphasized segment and two gray secondary segments, including data labels and legend. Slide 2 displays a 2-segment pie chart (blue vs. gray contrast) with descriptive text area. Both slides include title section at top and additional information input space at bottom.
Related Products
-

Performance Analysis Pie Chart – Market Share Visualization
#Market and Competitor Analysis #Diagram #Graph
-

Market Analysis Report Visualized with Pie Chart
#Market and Competitor Analysis #Diagram #Graph
-

Pie Chart Performance Analysis – Visualizing Market Share
#Market and Competitor Analysis #Diagram #Graph
-

Target Market Share Analysis – Visualizing Market Analysis with Pie Chart
#Market and Competitor Analysis #Graph #Other
