Table Chart of Point Frames – Profit and Loss Statement and Key Financial Metrics
RJ0900030_28
- Last Update 08/25/2025
- File Size 0.3MB
- # of Slides 2
- File Format PPTX
- Slide Ratio 16:9
- Color
Keywords
- #Content-Based Slides
- #Design-Based Slides
- #Financial Plans and Performance
- #Diagram
- #Income Statement
- #Key Financial Indicators
- #Table
- #Standard Table
- #16:9
- #table chart PowerPoint
- #financial data presentation slide
- #profit and loss statement template
- #data table slide design
- #financial metrics PPT
About the Product
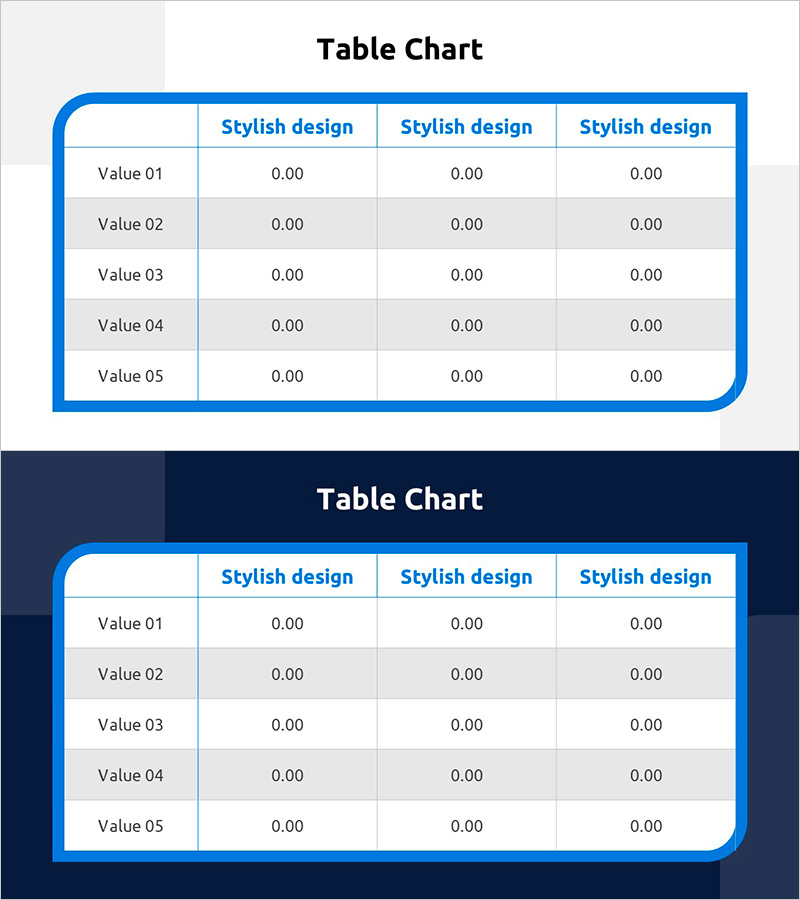
A PowerPoint slide presenting five financial data items in an organized table format with blue point frame design. Two versions are provided: light background and dark background, both featuring a clean layout optimized for numerical information display. Perfect for presenting profit and loss statements, key financial metrics, and quarterly performance comparisons. The three-column structure enables quick data comparison during presentations, making it an immediately usable slide template for financial reporting and business analysis.
Usage Points
-
Main Usage
The primary objective is to communicate financial data, performance metrics, and comparative analysis information in a structured table format that is immediately comprehensible to audiences. Ideal for presenting profit and loss statements, quarterly revenue status, and key performance indicators.
-
How to Use
Use this slide in financial reports, business performance presentations, and investor relations meetings to display critical numerical data in organized table format. The light background suits daytime presentations, while the dark background works well for evening events or projector environments. Cell values are fully editable for inputting actual financial data.
-
Recommended For
Recommended for CFOs, finance managers, executives, consultants, and investor relations professionals presenting financial status. Particularly useful for quarterly earnings presentations, budget planning explanations, and financial analysis reports.
-
Slide Structure
Structured as a 5-row by 3-column table with row labels (Value 01 through Value 05) on the left in gray background and column headers (Stylish design) at the top in blue. A blue point frame border surrounds the entire table, providing visual cohesion and emphasis.
Related Products
-

Paper Theme Key Financial Indicators Slide
#Financial Plans and Performance #Diagram #Income Statement
-

Visualizing Financial Performance with Business Table Chart – Intuitive and Effective
#Financial Plans and Performance #Diagram #Income Statement
-

Key Financial Indicators Table – Effective Data Presentation
#Financial Plans and Performance #Diagram #Income Statement
-

Premium Management Presentation Table – Efficient Financial Planning
#Financial Plans and Performance #Diagram #Income Statement
