Magic Donut Chart for Market Share Visualization – Key Information Delivery
RJ0600042_14
- Last Update 07/02/2025
- File Size 0.4MB
- # of Slides 2
- File Format PPTX
- Slide Ratio 16:9
- Color
Keywords
- #Content-Based Slides
- #Design-Based Slides
- #Product/Service Introduction
- #Market and Competitor Analysis
- #Diagram
- #Graph
- #Development Status
- #Market Share
- #Cluster
- #Circles
- #Chain Diagram
- #Doughnut Chart
- #16:9
- #donut chart PowerPoint
- #pie chart slide template
- #market share visualization
- #data ratio presentation
- #3-section chart download
About the Product
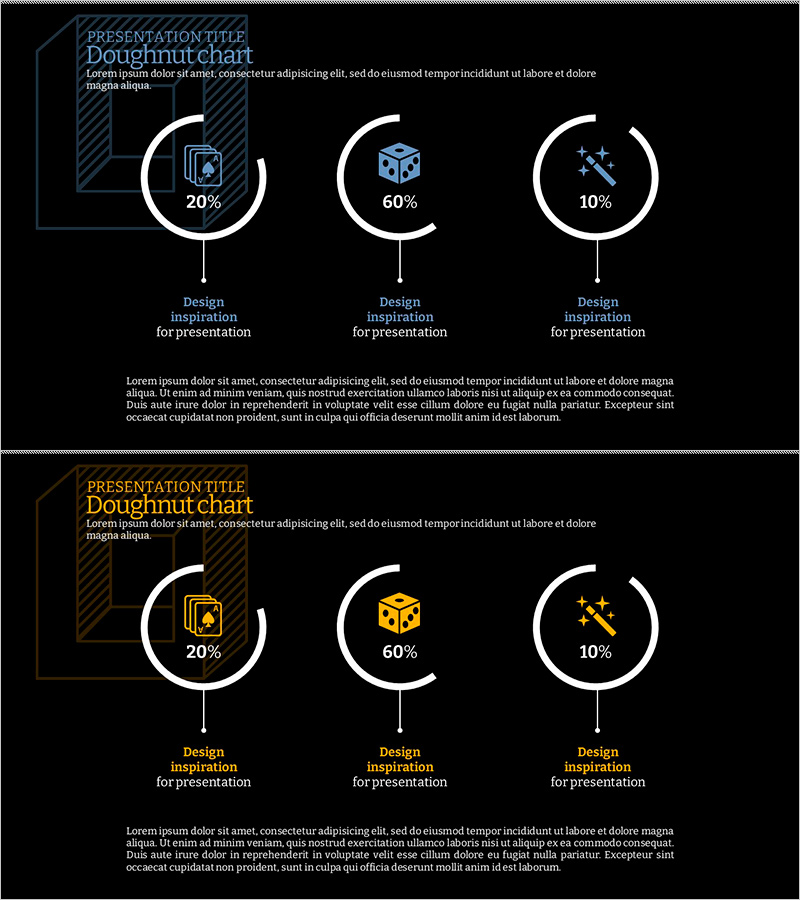
A professional donut chart PowerPoint slide designed to visualize market share, sales distribution, and customer composition with clarity and impact. Each segment features an icon and percentage label for immediate data comprehension. The dark background with white circular borders and colorful icons creates strong visual emphasis, making it ready for business presentations and reports. The 2-slide set offers multiple color variations (blue and gold tones) that can be customized to match your corporate branding and presentation style.
Usage Points
-
Main Usage
Ideal for visualizing market share, sales distribution, budget allocation, and customer composition as proportions of a whole. The donut structure allows for additional text or logo placement in the center, increasing information density and visual interest.
-
How to Use
Use in market analysis sections of business reports, quarterly performance presentations, investor pitch decks, and marketing strategy presentations. Simply edit the percentage values and labels to reflect your actual data and customize colors to match your brand guidelines.
-
Recommended For
Marketing managers, sales directors, financial analysts, and executives presenting quantitative data. Perfect for any business presentation requiring comparison of 3–5 proportional segments with visual impact and professional appearance.
-
Slide Structure
2-slide set with each slide containing 3 donut chart segments (example: 20%, 60%, 10%). Each segment includes an icon, percentage value, and descriptive text area. Dark background with white circular borders provides strong data emphasis and visual hierarchy.
Related Products
-

Development Status Donut Graph – Market Share Visualization
#Product/Service Introduction #Market and Competitor Analysis #Diagram
-

Aviation Service Development Schedule Donut Circle Graph
#Product/Service Introduction #Market and Competitor Analysis #Diagram
-

Status of Research and Development by Topic – Innovation and Trust
#Product/Service Introduction #Market and Competitor Analysis #Diagram
-

System Development Status Graph – Visualizing Market Share
#Product/Service Introduction #Market and Competitor Analysis #Diagram
