Business Service Composition Diagram – Intuitive Visualization and Strategic Guidance
RM0100014_27
- Last Update 01/29/2025
- File Size 0.3MB
- # of Slides 2
- File Format PPTX
- Slide Ratio 16:9
- Color
Keywords
- #Content-Based Slides
- #Design-Based Slides
- #Business Vision and Strategy
- #Technical Approach
- #Diagram
- #Graph
- #Other
- #Business Vision
- #Service Architecture Diagram
- #Cluster
- #Closed Cluster Diagram
- #16:9
- #service composition diagram
- #business structure PowerPoint
- #cluster diagram slide
- #3-stage organizational chart
- #business strategy presentation template
About the Product
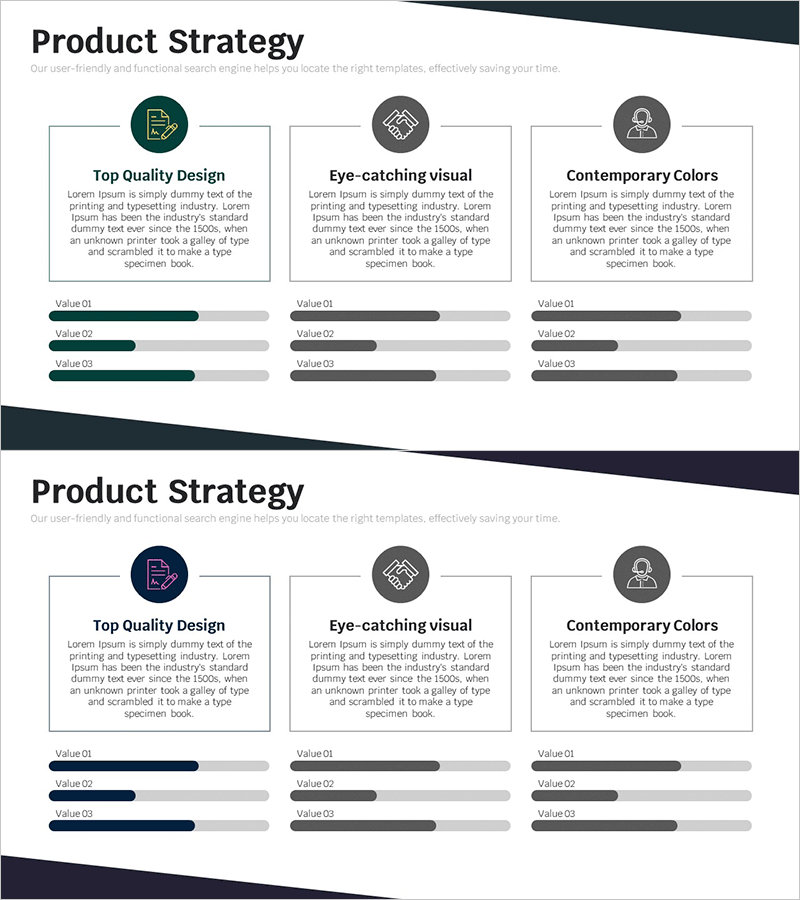
A professional PowerPoint slide featuring a three-stage cluster diagram that visualizes business service composition and organizational structure. The design uses a dark teal background with white typography and icons, creating a corporate aesthetic suitable for executive presentations. The central service node expands outward in a radial pattern, clearly illustrating strategic relationships and hierarchical connections. Both slides are fully editable in standard PowerPoint, allowing customization of text, colors, and icons to match your company branding. The 16:9 widescreen format with 2-slide layout works seamlessly for service introductions, business structure explanations, and organizational role presentations.
Usage Points
-
Main Usage
Designed to communicate complex business service structures and organizational hierarchies in a clear, visually compelling format. The radial cluster layout with central core and expanding peripheral elements effectively conveys strategic relationships, service dependencies, and business vision. Ideal for presenting to investors, stakeholders, and team members who need to understand your service ecosystem and competitive positioning.
-
How to Use
Customize each section by replacing placeholder text with your specific services, departments, or business units. Position foundational services on the left, core value proposition in the center, and expansion services on the right. All elements—text, icons, shapes, and colors—are fully editable using standard PowerPoint tools. Adjust the color scheme to match corporate branding guidelines and add company logos or additional icons as needed.
-
Recommended For
Perfect for business plans, company overview presentations, product service introductions, and strategic planning documents. Recommended for executives, marketing teams, business development professionals, and sales teams explaining service portfolios. Particularly effective for investor pitches, new business proposals, organizational restructuring announcements, and cross-functional strategy communications.
-
Slide Structure
Two-slide set with base diagram layout and text-emphasized variation. Each slide contains five editable zones: one central circular node representing core service and four surrounding nodes arranged in radial pattern showing supporting or complementary services. Connected by directional arrows and relationship lines to emphasize hierarchical flow. Optimized for 16:9 widescreen format with professional spacing and alignment.
Related Products
-

Introduction to Types of Chemical Experiments – Effective Information Delivery
#Business Vision and Strategy #Diagram #Graph
-

Competitor Benchmarking & Positioning Map Slide
#Product/Service Introduction #Technical Approach #Diagram
-

Price Quality Positioning Map – Market and Competitor Analysis
#Market and Competitor Analysis #Marketing Plan and Strategy #Diagram
-

Positioning Area Graph – Essential Slide for Market Analysis
#Market and Competitor Analysis #Marketing Plan and Strategy #Diagram
