Space Industry Segmentation Bar Graph – Essential for Market Analysis
RJ0700015_22
- Last Update 07/26/2025
- File Size 0.7MB
- # of Slides 2
- File Format PPTX
- Slide Ratio 16:9
- Color
Keywords
- #Content-Based Slides
- #Design-Based Slides
- #Market and Competitor Analysis
- #Diagram
- #Graph
- #Competitor Analysis
- #Market Analysis
- #Cluster
- #Horizontal Bar
- #Closed Cluster Diagram
- #Segmented Horizontal Bar
- #16:9
- #horizontal bar chart PowerPoint
- #market segmentation slide template
- #industry analysis presentation
- #data visualization PowerPoint
- #how to create bar chart in PowerPoint
About the Product
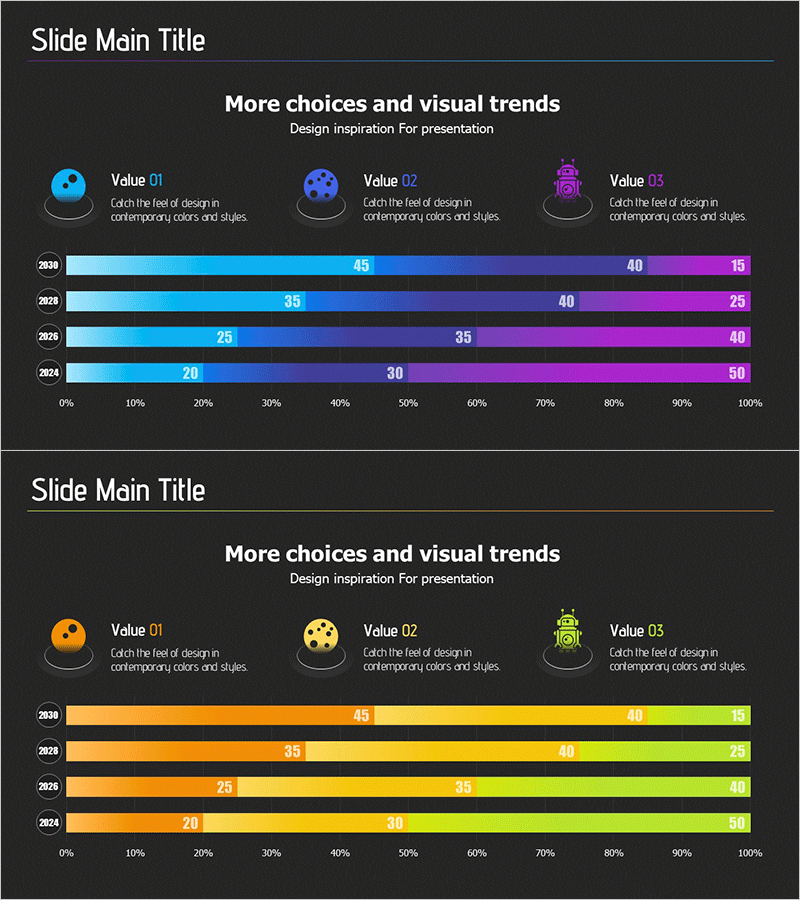
A horizontal bar chart PowerPoint slide designed for space industry market analysis and segmentation visualization. This presentation template displays data across four years (2030 to 2024) with three data series represented in cyan, purple, and magenta gradient colors. Each year shows the proportional breakdown of market categories, enabling clear comparison of market share trends and competitive positioning. The slide deck is ready to use in business reports, market analysis presentations, and investment pitch decks.
Usage Points
-
Main Usage
Ideal for comparing market size across industries, regions, or product categories over multiple years. The stacked horizontal bar format effectively communicates market segmentation trends and competitive share shifts in a single visual.
-
How to Use
Insert into the market analysis section of business plans, marketing strategies, or investor pitch decks. Edit the numerical values to match your data, customize the legend and axis labels, and adjust colors to align with your corporate branding.
-
Recommended For
Strategic planning teams, marketing departments, sales teams, and executive presentations. Perfect for new market entry assessments, competitive positioning analysis, and opportunity evaluation reports.
-
Slide Structure
Two-slide set, each displaying four years of data (2030, 2029, 2026, 2024) with three stacked series. First slide uses cyan-purple-magenta gradient; second slide features orange-yellow-green palette. Both include 0-100% horizontal axis scale and year labels for easy data reading.
Related Products
-

Market Analysis Graph Ahead of the Future – Innovative Business Insights
#Market and Competitor Analysis #Diagram #Graph
-

Segmented Bar Graph for Market and Competitor Analysis
#Market and Competitor Analysis #Graph #Competitor Analysis
-

Simple Cement Theme Analysis Chart – Understanding Competitor and Market Context
#Market and Competitor Analysis #Diagram #Graph
-

Graph Slide for Market and Competitor Analysis – Online Market Overview
#Market and Competitor Analysis #Diagram #Graph
