Segmented Bar Graph for Market and Competitor Analysis
RJ0300042_7
- Last Update 04/29/2025
- File Size 0.3MB
- # of Slides 2
- File Format PPTX
- Slide Ratio 16:9
- Color
Keywords
- #Content-Based Slides
- #Design-Based Slides
- #Market and Competitor Analysis
- #Graph
- #Competitor Analysis
- #Market Analysis
- #Horizontal Bar
- #Segmented Horizontal Bar
- #16:9
- #segmented horizontal bar chart
- #bar chart PowerPoint
- #data comparison slide
- #market analysis presentation
- #competitor analysis graph
- #PowerPoint slide template
- #how to create bar chart in PowerPoint
About the Product
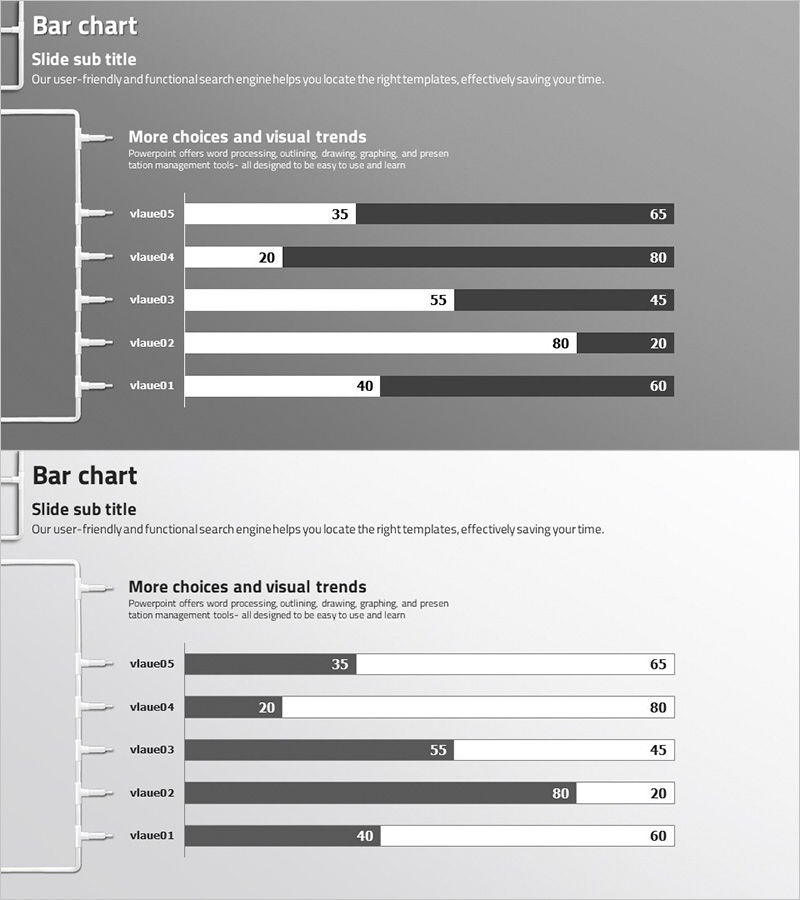
A segmented horizontal bar chart PowerPoint slide optimized for market analysis and competitor comparison. This presentation template displays 5 items with 2 data series side by side, enabling intuitive numerical comparison. Two design variations are included: one with a gray background and one with a white background. Each slide features clearly labeled bars with numerical values, allowing you to input data and present immediately. This slide deck is ideal for marketing strategies, business plans, quarterly performance reports, and various professional presentations requiring data visualization.
Usage Points
-
Main Usage
Compares two data series across 5 items, such as market size, market share, or competitor performance metrics. The horizontal bar layout clearly shows relative differences and rankings, making it easy to identify gaps and trends at a glance.
-
How to Use
Replace the value01–value05 labels with your actual item names and input the corresponding numerical values for each series. The bar lengths automatically adjust to reflect your data. Use the gray background version for formal reports and investor presentations, and the white background for internal meetings and training materials.
-
Recommended For
Marketing managers, strategy planners, sales directors, financial analysts, and consultants presenting market conditions, competitive analysis, or performance comparisons. Suitable for quarterly business reviews, new business proposals, and client reporting presentations.
-
Slide Structure
2-slide set. First slide features a gray background with 5 horizontal bars (value01–value05) representing 2 data series in light and dark gray. Second slide presents the same structure on a white background. Each bar displays numerical labels. Both slides are formatted in 16:9 widescreen aspect ratio for modern presentation displays.
Related Products
-

Market Analysis Bar Graph – Effective Visualization for Competitor Analysis
#Market and Competitor Analysis #Graph #Competitor Analysis
-

Financial Management Analysis Detailed Graph
#Market and Competitor Analysis #Graph #Competitor Analysis
-

Business Partner Analysis Bar Graph – Market Insights
#Market and Competitor Analysis #Graph #Competitor Analysis
-

Blue Green Subdivided Graph – Template for Market and Competitor Analysis
#Market and Competitor Analysis #Graph #Competitor Analysis
