Medicine Bottle Shape Diagram for Market Analysis – Insight Generation
RJ0700014_24
- Last Update 07/25/2025
- File Size 0.4MB
- # of Slides 2
- File Format PPTX
- Slide Ratio 16:9
- Color
Keywords
- #Content-Based Slides
- #Design-Based Slides
- #Market and Competitor Analysis
- #Diagram
- #Graph
- #Market Analysis
- #Cluster
- #Closed Cluster Diagram
- #16:9
- #medicine bottle diagram PowerPoint
- #cluster diagram slide template
- #market analysis PowerPoint
- #competitive analysis slide
- #hierarchical diagram template
- #data visualization presentation
About the Product
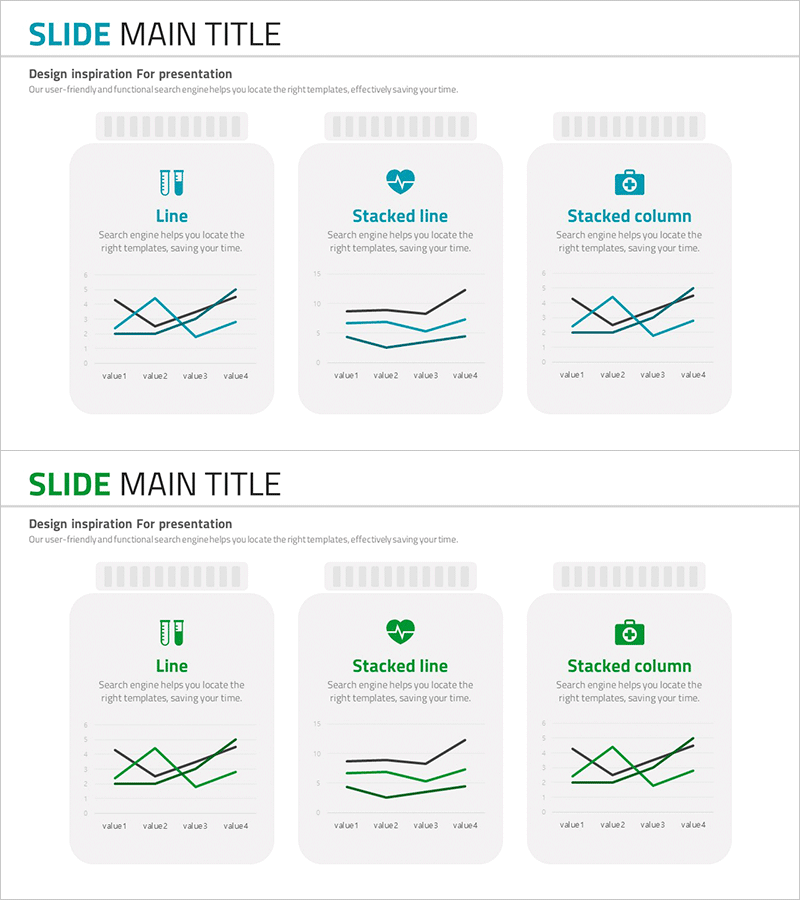
A PowerPoint slide featuring a medicine bottle-shaped closed cluster diagram for hierarchical market analysis visualization. Ideal for pharmaceutical, healthcare, and consumer goods industries to present competitive analysis, market segmentation, and product positioning. The 2-slide set uses teal and green dual-tone color schemes with clearly defined input areas at each layer for intuitive data representation. Delivered in 16:9 widescreen PPTX format, fully editable and ready to integrate into presentations, reports, and strategic proposals.
Usage Points
-
Main Usage
Visualize market analysis data using a medicine bottle-shaped closed cluster diagram, enabling pharmaceutical, healthcare, and consumer goods professionals to present competitive landscapes, market segmentation, product positioning, and customer classification in a hierarchical structure that enhances presentation persuasiveness.
-
How to Use
Input market data, competitor names, product names, and customer segments into each layer's designated areas. Adjust colors and text sizes to emphasize priority levels. Insert into business plans, marketing strategy documents, and quarterly reports' market analysis sections to support data-driven decision-making.
-
Recommended For
Pharmaceutical companies, medical device manufacturers, FMCG marketing teams, strategy consultants, business development professionals, and market research analysts. Suitable for executive briefings, investor pitches, internal strategy meetings, and client proposal presentations.
-
Slide Structure
2-slide composition. First slide presents a medicine bottle-shaped 3-layer cluster diagram in teal tones; second slide displays the identical structure in green tones. Each layer contains 3–4 input areas with connecting lines that clearly indicate hierarchical relationships between nodes.
Related Products
-

Watch Shape Market Share Graph – Data Visualization and Analysis
#Product/Service Introduction #Market and Competitor Analysis #Diagram
-

Business Plan Competitor Analysis Chart – Effective Market Analysis Tool
#Market and Competitor Analysis #Diagram #Graph
-

Business Idea Development Analysis Circle Graph
#Business Introduction #Market and Competitor Analysis #Diagram
-

Vertical Bar Graph & Folder Diagram – Market and Competitor Analysis
#Market and Competitor Analysis #Diagram #Graph
