Business Idea Development Analysis Circle Graph
RJ0300070_17
- Last Update 05/08/2025
- File Size 0.1MB
- # of Slides 2
- File Format PPTX
- Slide Ratio 16:9
- Color
Keywords
- #Content-Based Slides
- #Design-Based Slides
- #Business Introduction
- #Market and Competitor Analysis
- #Diagram
- #Graph
- #Technological Status
- #Market Analysis
- #Cluster
- #Circles
- #Closed Cluster Diagram
- #Doughnut Chart
- #16:9
- #donut chart PowerPoint slide
- #pie chart template
- #4-section data visualization
- #business idea analysis slide
- #proportional chart PowerPoint download
About the Product
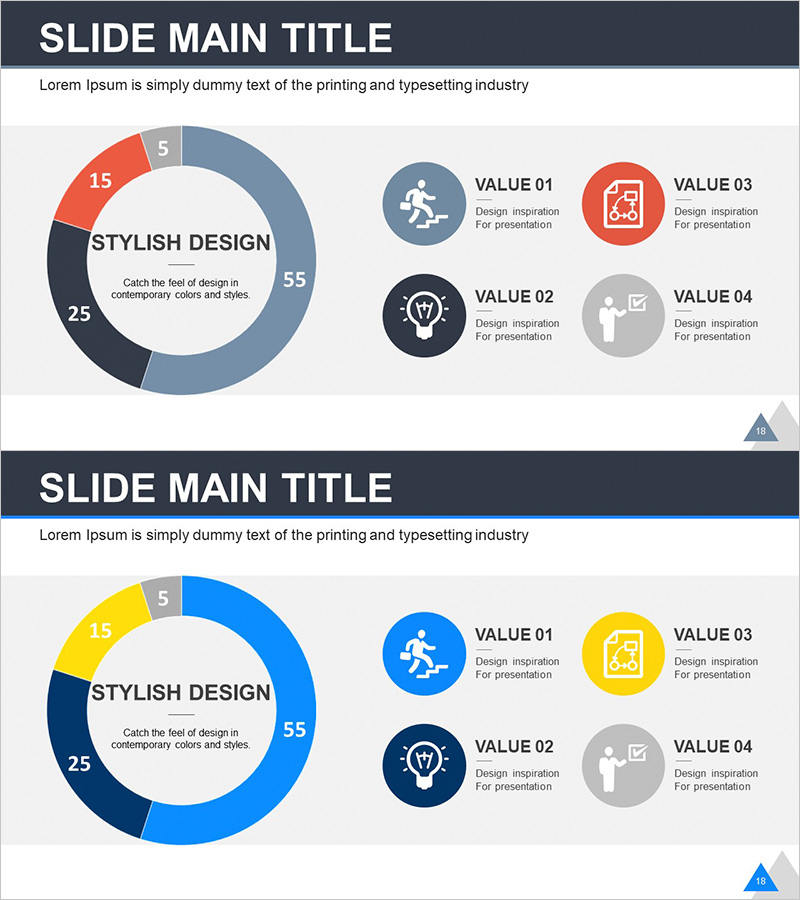
A donut-shaped pie chart PowerPoint slide that visualizes business idea development stages across four segments with proportional data representation (55%, 25%, 15%, 5%). The center features a 'Stylish Design' core message, while the right side displays four icon-based VALUE items (person, lightbulb, document, presentation) for enhanced information delivery. Color scheme includes slate blue, charcoal, coral red, and light gray for clear segment differentiation. A second slide variant applies a brighter blue palette while maintaining the same structure. Both slides are fully editable in PPTX format, making them ideal for business presentations, market analysis reports, and strategic planning documents.
Usage Points
-
Main Usage
Designed to visually represent business idea development stages with proportional emphasis on each phase. The donut structure highlights a central core message while clearly communicating the relationship between four segments. Ideal for expressing weighted importance across market analysis, technology assessment, competitive positioning, and customer needs evaluation.
-
How to Use
Replace the default percentages (55%, 25%, 15%, 5%) with your actual data values. Customize the VALUE 01-04 text labels and icons to match your presentation topic. Choose between two color variants (slate blue or bright blue palette) to maintain visual consistency with your overall presentation design and corporate branding.
-
Recommended For
Business strategists, marketing teams, management consultants, startup founders, and investment professionals presenting idea development phases, market analysis results, or technology roadmap proportions. Effective for executive briefings, investor pitch decks, and strategic planning meetings.
-
Slide Structure
Two-slide set with identical donut chart structure but different color schemes. First slide uses slate blue, charcoal, coral red, and light gray palette; second applies bright blue variant. Each slide features a centered donut chart with four proportional segments and right-aligned four-item VALUE section with circular icons. Two-column layout balances central data visualization with supplementary information.
Related Products
-

Trend Color Donut Chart – Innovating Data Analysis
#Business Introduction #Market and Competitor Analysis #Graph
-

Vaccine Research Status Graph – Market and Competitive Analysis
#Market and Competitor Analysis #Diagram #Graph
-

Donut Chart Comparing Market Share by Coffee Brand
#Market and Competitor Analysis #Diagram #Graph
-

Analysis Graph by Car Type – Insights with Doughnut Chart
#Business Introduction #Market and Competitor Analysis #Graph
