Spaceship Configuration Contents PowerPoint Template – Scientific Approach and Creativity
RJ0700013_5
- Last Update 07/25/2025
- File Size 1.2MB
- # of Slides 2
- File Format PPTX
- Slide Ratio 16:9
- Color
Keywords
- #Content-Based Slides
- #Design-Based Slides
- #Company Introduction
- #Product/Service Introduction
- #Diagram
- #Graph
- #Business Areas
- #Composition
- #Cluster
- #Circles
- #Closed Cluster Diagram
- #Doughnut Chart
- #16:9
- #donut diagram PowerPoint
- #circular configuration chart slide
- #4-segment pie chart
- #spaceship diagram PPT
- #component visualization PowerPoint
About the Product
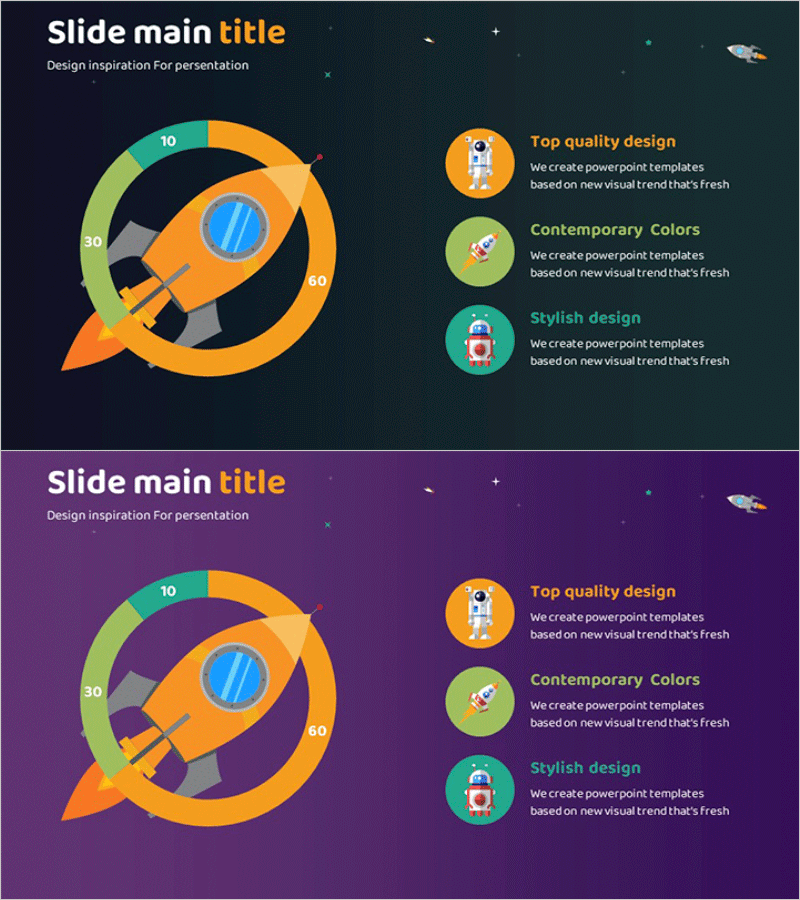
A donut-shaped diagram PowerPoint slide visualizing spaceship launch components across four segments. The circular chart features orange, green, gray, and blue gradient colors with a central rocket icon and numerical labels (10, 30, 60) to represent proportional distribution of each component. The right side includes three feature items (Top quality design, Contemporary Colors, Stylish design) arranged with circular icons and descriptive text. Available in three background color options—dark navy, dark teal, and purple—in 2-slide 16:9 PPTX format ready for immediate editing. Ideal for technical presentations, proposal documents, and project structure explanations.
Usage Points
-
Main Usage
Optimized for analyzing and explaining project, product, or organizational components using circular proportional representation. The central icon and outer numerical labels enable instant comprehension of each segment's role and proportion, making it ideal for technical presentations, investment proposals, and project planning phases where complex structures must be communicated clearly and concisely.
-
How to Use
Open the slide and modify the donut chart segment text and numerical values to match your project context. Replace the right-side icons and descriptions with component-specific features, and select the background color (navy, teal, or purple) that aligns with your presentation theme. The rocket icon can be swapped for industry-specific alternatives, and all elements are built from standard PowerPoint shapes, allowing free adjustment of colors, sizes, and positions.
-
Recommended For
Technology and aerospace industry presenters, product development teams explaining component structures, investment proposal writers, project planning and status report managers, and educators conducting seminars who need to visually explain complex systems. Particularly effective when emphasizing the proportional weight of four key components.
-
Slide Structure
2-slide set. Both slides feature identical layouts with dark backgrounds (navy, teal, or purple options) displaying a left-side 4-segment donut chart with gradient colors, central rocket icon, and outer numerical labels (10, 30, 60), plus a right-side three-item feature section with circular icons, titles, and descriptive text. Formatted in 16:9 widescreen ratio optimized for modern projectors and displays.
Related Products
-

Camera App Configuration Diagram – Differentiated Business Introduction
#Company Introduction #Product/Service Introduction #Diagram
-

Health Checkup Data Analysis Circular Graph – Effective Business Data Visualization
#Product/Service Introduction #Market and Competitor Analysis #Diagram
-

Visualizing Genetic Research Data with a Donut Chart
#Product/Service Introduction #Market and Competitor Analysis #Diagram
-

Experimental Configuration Content Circle Graph
#Product/Service Introduction #Technical Approach #Diagram
