Business Area Diagram – Cluster Composition
RJ0300041_18
- Last Update 04/28/2025
- File Size 2MB
- # of Slides 2
- File Format PPTX
- Slide Ratio 16:9
- Color
Keywords
- #Content-Based Slides
- #Design-Based Slides
- #Company Introduction
- #Product/Service Introduction
- #Diagram
- #Business Areas
- #Composition
- #Cluster
- #Closed Cluster Diagram
- #16:9
- #closed-form cluster diagram
- #circular node PowerPoint slide
- #business area diagram
- #3-segment cluster visualization
- #business division PPT template
- #organizational structure diagram PowerPoint
About the Product
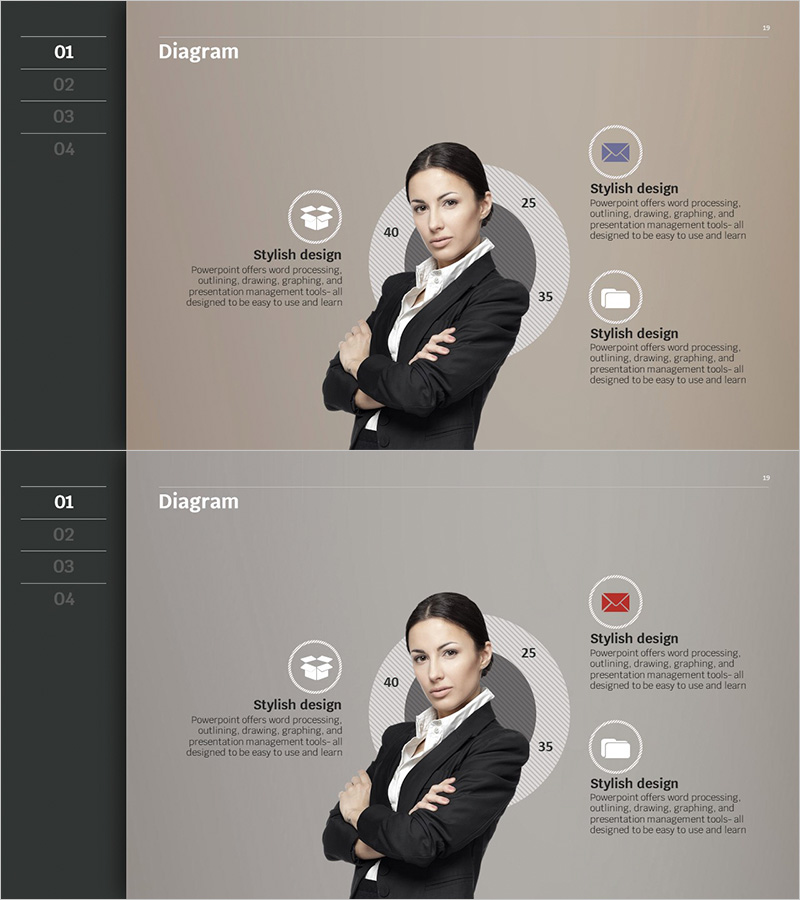
A PowerPoint cluster diagram slide featuring three closed-form circular nodes arranged around a central figure, representing interconnected business areas. The beige-toned background with white circular borders and icons clearly delineates each segment, while numeric indicators (25, 35, 40) visualize proportional weight or priority. This design effectively communicates business divisions, organizational roles, functional areas, or service categories in presentations and strategic documents. The 2-slide set is ready for immediate customization and deployment in corporate communications.
Usage Points
-
Main Usage
Visualize organizational business divisions, service areas, or functional roles using a central-hub cluster model with three closed-form circular nodes. Numeric indicators simultaneously convey quantitative metrics and qualitative categorization, making this design ideal for company overviews, strategic presentations, and organizational restructuring reports.
-
How to Use
Enter area names and descriptions into the three surrounding circular nodes, with the central figure or topic as the primary focus. Numeric values can be adjusted to reflect proportions, priorities, or performance metrics. Icons are easily replaceable to match each area's characteristics, and background and node colors can be customized to align with corporate branding guidelines.
-
Recommended For
Executives, planning teams, and marketing departments use this template to present business portfolios, organizational structures, customer segments, or product lineups. Highly effective in consulting reports, investor pitch decks, business plans, and organizational change communications where complex structures must be conveyed clearly and concisely.
-
Slide Structure
2-slide set. Each slide features a central figure or topic with three closed-form circular nodes positioned around it. Each node contains an icon, title, and descriptive text area. Numeric indicators (25, 35, 40) represent proportional distribution. The beige background with white borders and gray gradient circles creates visual depth and professional appearance.
Related Products
-

Spaceship Configuration Contents PowerPoint Template – Scientific Approach and Creativity
#Company Introduction #Product/Service Introduction #Diagram
-

Camera App Configuration Diagram – Differentiated Business Introduction
#Company Introduction #Product/Service Introduction #Diagram
-

Furniture Product Details Slide - Cluster Design
#Product/Service Introduction #Diagram #Composition
-

System Architecture for Efficient Communication
#Product/Service Introduction #Diagram #Features
