Technology Achievement Donut Chart
RJ0900003_21
- Last Update 08/29/2025
- File Size 0.8MB
- # of Slides 2
- File Format PPTX
- Slide Ratio 16:9
- Color
Keywords
- #Content-Based Slides
- #Design-Based Slides
- #Product/Service Introduction
- #Business Introduction
- #Graph
- #Other
- #Development Status
- #Technological Status
- #Circles
- #Doughnut Chart
- #Mockup
- #16:9
- #doughnut chart PowerPoint slide
- #donut chart template
- #technology achievement rate visualization
- #development progress graph
- #circular chart PowerPoint download
About the Product
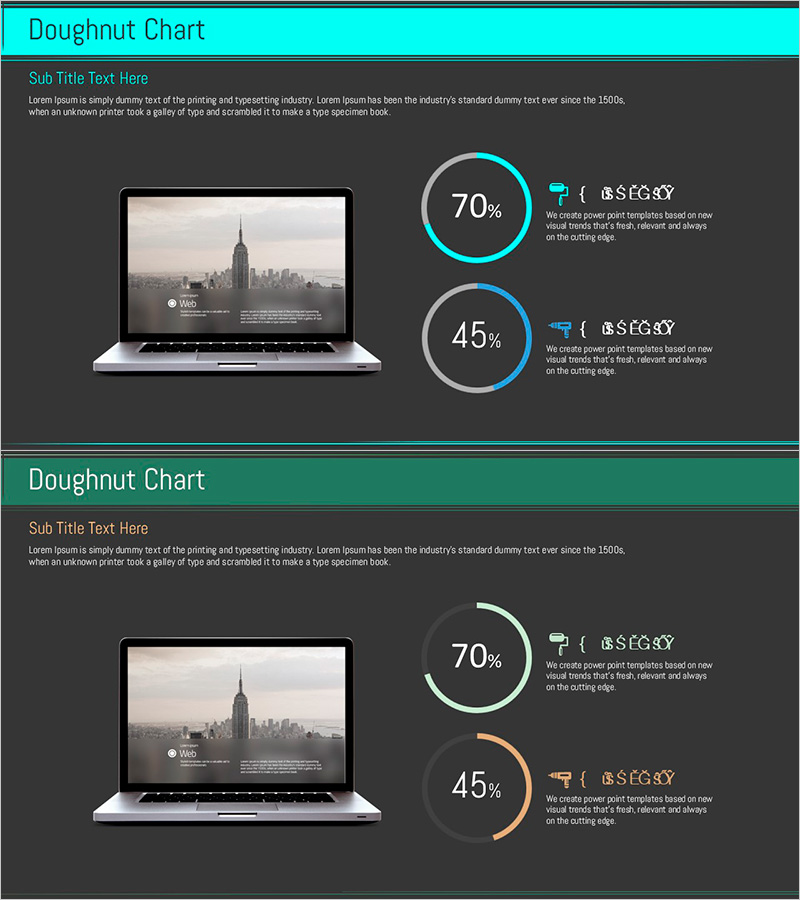
A professional doughnut chart PowerPoint slide set featuring two circular charts to visualize technology achievement rates and development progress. The slides display 70% and 45% metrics with a dark background, cyan and orange accent lines, and a laptop mockup image on the left side. Perfect for technology reports, development status presentations, technical strategy meetings, and project progress updates. The charts are fully editable in PowerPoint, allowing you to customize percentages, labels, and colors to match your specific technical metrics and organizational branding.
Usage Points
-
Main Usage
Visualize technology development progress, project completion rates, and technical maturity assessments using circular doughnut charts. The dual-chart layout enables side-by-side comparison of different technical metrics, performance indicators, or progress across multiple development phases.
-
How to Use
Incorporate into technology reports, development status presentations, technical strategy meetings, and investor briefings. The integrated laptop mockup image enhances credibility for IT, software, and hardware company presentations. Easily modify percentages, labels, and data values directly within PowerPoint to reflect your current technical metrics.
-
Recommended For
Technology managers, development team leads, project managers, technical planners, and R&D department professionals presenting technology status to executives or investors. Ideal for IT companies, software development firms, hardware manufacturers, and technology consulting organizations delivering regular progress reports.
-
Slide Structure
2-slide set with consistent layout: laptop mockup image positioned on the left, two doughnut charts on the right. Slide 1 features cyan accent lines; Slide 2 uses orange accent lines for visual differentiation. Each chart displays percentage values (70%, 45%), legend icons, and supporting text. 16:9 widescreen format, fully editable PPTX file.
Related Products
-

Business Analysis with Doughnut Chart – Dawn City Theme
#Product/Service Introduction #Business Introduction #Diagram
-

Mobile App Service Development Status – Doughnut Chart Visualization
#Product/Service Introduction #Business Introduction #Graph
-

Five Color PowerPoint Template Wide – Donut Chart
#Product/Service Introduction #Business Vision and Strategy #Graph
-

Plastic Surgery Data Analysis Donut Pie Chart Slide
#Product/Service Introduction #Graph #Other
