Infographic Slide for Performance Analysis – Clear Visualization
RJ0300063_7
- Last Update 05/05/2025
- File Size 4.4MB
- # of Slides 2
- File Format PPTX
- Slide Ratio 16:9
- Color
Keywords
- #Content-Based Slides
- #Design-Based Slides
- #Product/Service Introduction
- #Business Introduction
- #Graph
- #Other
- #Development Status
- #Technological Status
- #16:9
- #infographic slide PowerPoint
- #4-section comparison analysis PPT
- #business performance analysis slide
- #data visualization presentation
- #how to create infographic slides
About the Product
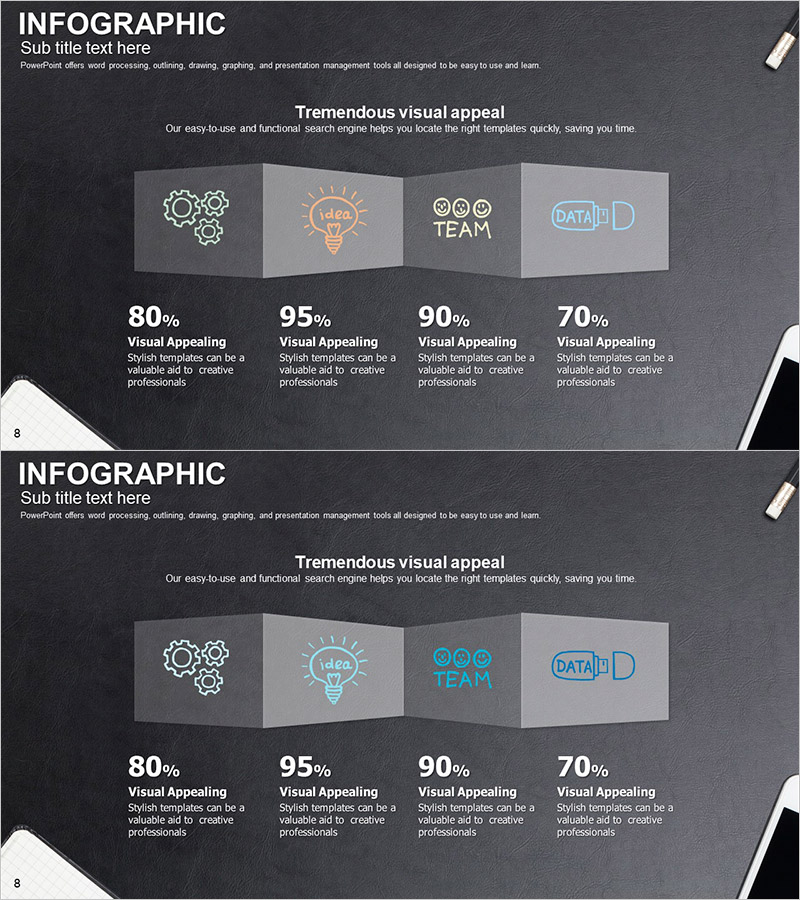
A professional infographic PowerPoint slide designed for business performance analysis and data visualization. The slide features a dark gray background with four 3D box-shaped icon sections (gears, idea, team, data), each with percentage metrics and descriptive text fields below. Ideal for presenting business analysis, performance reports, and marketing insights with immediate usability. The template uses a 16:9 widescreen format in PPTX, consisting of 2 slides that transform complex information into intuitive visual comparisons.
Usage Points
-
Main Usage
This infographic slide enables you to categorize and compare complex business data and performance metrics across four key areas simultaneously. Each section accommodates an icon, percentage value, and descriptive text, allowing quantitative analysis results to be communicated intuitively to your audience.
-
How to Use
Use this slide in business performance reports, marketing campaign analysis, team capability assessments, and market research presentations where you need to present four major metrics side-by-side. Simply edit the text and numerical values in each box to match your specific data and customize the layout to your brand.
-
Recommended For
Recommended for executives, marketing professionals, data analysts, and consultants presenting quarterly business reviews, investor pitches, marketing performance summaries, consulting proposals, and strategic analysis meetings where key metrics require emphasis.
-
Slide Structure
The slide set includes two color variations. Each version contains a title area, subtitle text, four 3D box-shaped icon sections (each with editable icon, label, percentage, and description fields), and a footer with page numbering for seamless integration into presentations.
Related Products
-

Architectural Illustration Gauge Chart – Visualizing Technical Status
#Product/Service Introduction #Business Introduction #Graph
-

Comparative Analysis Graph of Work Progress Status – Visual Data Insights
#Product/Service Introduction #Business Introduction #Diagram
-

Carbon Neutral Infographic Eco-Friendly Battery Chart – Modern Technology and Sustainability
#Product/Service Introduction #Business Introduction #Graph
-

Musicians and Gauge Charts Slide – The Uniqueness of Data Visualization
#Product/Service Introduction #Business Introduction #Graph
