Comparative Analysis Graph of Work Progress Status – Visual Data Insights
RJ0300092_19
- Last Update 05/15/2025
- File Size 1.8MB
- # of Slides 2
- File Format PPTX
- Slide Ratio 16:9
- Color
Keywords
- #Content-Based Slides
- #Design-Based Slides
- #Product/Service Introduction
- #Business Introduction
- #Diagram
- #Graph
- #Other
- #Development Status
- #Technological Status
- #Cluster
- #Closed Cluster Diagram
- #16:9
- #comparative analysis chart PowerPoint
- #progress rate bar chart
- #PowerPoint data visualization
- #work progress status slide
- #3-item comparison template
About the Product
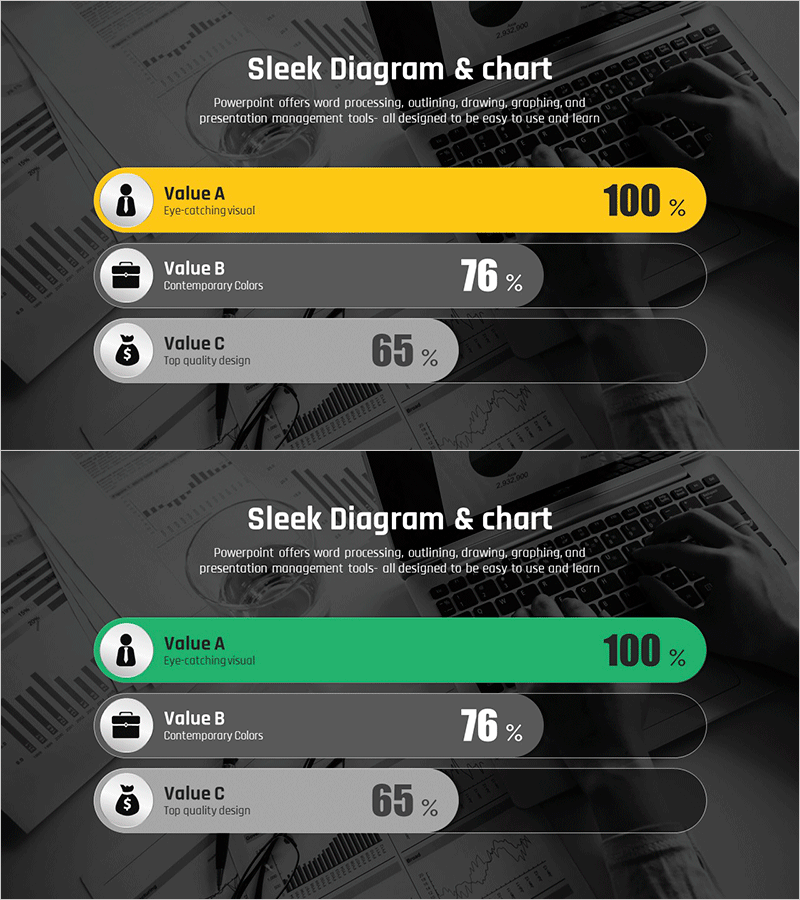
A horizontal bar chart PowerPoint slide for comparing and analyzing work progress across three items. Features yellow, gray, and black accent colors with icons and percentage values to intuitively convey progress rates for each item. Provided in 2-slide format with the first emphasizing yellow and the second emphasizing green, allowing you to select the version that matches your presentation context. Against a dark background with clear text contrast, this slide is ready to use for project status reports, performance analysis, results comparison, and various business presentations.
Usage Points
-
Main Usage
Compare and analyze numerical data for three items such as project progress, departmental performance, and results comparison at a glance using horizontal bar charts. Percentage-based progress indicators clearly communicate goal achievement, while icons make the meaning of each item intuitive to understand.
-
How to Use
Use in business reports, quarterly performance presentations, and team results analysis materials when comparing key metrics. Select the yellow or green emphasis version that matches your presentation theme and tone, place it on your slide, and edit the text and values to input your actual data.
-
Recommended For
Effective for executives, managers, and project leaders reporting team performance; marketing, sales, and operations departments preparing results analysis materials; and explaining progress to investors and stakeholders.
-
Slide Structure
2-slide format. Each slide features a horizontal bar chart with 3 items, arranged with icons (person, briefcase, money bag) on the left, item names and descriptions in the center, and percentage values on the right. The first slide emphasizes yellow; the second emphasizes green for color variation options.
Related Products
-

Medical Research Progress Diagram – Innovation and Development
#Product/Service Introduction #Business Introduction #Diagram
-

Idea Development Analysis Chart – Data-Driven Innovation
#Product/Service Introduction #Business Introduction #Diagram
-

Technology Achievement Donut Chart
#Product/Service Introduction #Business Introduction #Graph
-

Musicians and Gauge Charts Slide – The Uniqueness of Data Visualization
#Product/Service Introduction #Business Introduction #Graph
