Big Data Cloud Analysis Graph – Market Competition Analysis
RJ0400059_28
- Last Update 06/03/2025
- File Size 1.2MB
- # of Slides 2
- File Format PPTX
- Slide Ratio 16:9
- Color
Keywords
- #Content-Based Slides
- #Design-Based Slides
- #Market and Competitor Analysis
- #Graph
- #Competitor Analysis
- #Market Analysis
- #Horizontal Bar
- #Segmented Horizontal Bar
- #16:9
- #horizontal bar chart PowerPoint
- #market analysis slide template
- #year-over-year comparison graph
- #big data visualization chart
- #competitive analysis presentation slide
About the Product
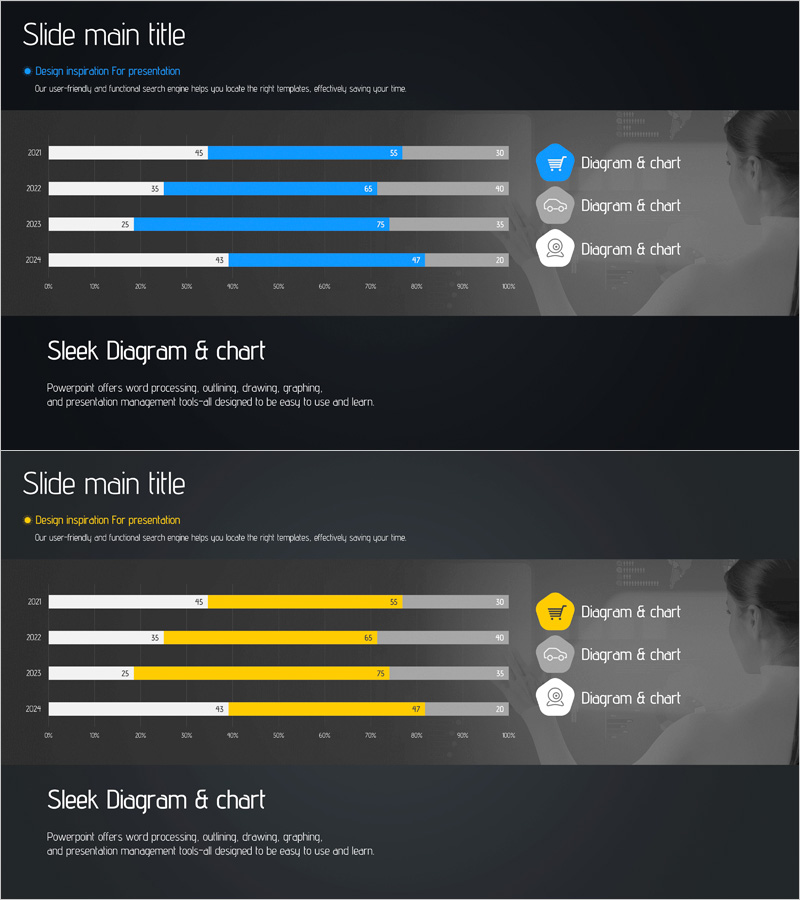
A horizontal bar chart PowerPoint slide optimized for market analysis and competitive comparison. Featuring a dark background with blue and yellow dual-tone colors, this presentation template visualizes 4-year data trends with clear numerical labels for each item. Ideal for big data analysis, cloud technology adoption rates, and market share comparisons. The 2-slide deck presents multiple layout variations, formatted in 16:9 widescreen ratio and PPTX for seamless editing in modern PowerPoint versions. Ready to download and customize for your business presentation.
Usage Points
-
Main Usage
Display year-over-year trends, item-by-item numerical comparisons, and market share changes at a glance using horizontal bar charts for data-driven decision-making materials. Effective for visualizing big data analytics, cloud technology adoption rates, and competitor performance benchmarks.
-
How to Use
Insert into business reports, market analysis presentations, and executive briefing materials in the year-over-year or item comparison section. Double-click numerical labels to replace with actual data, and adjust bar lengths to reflect proportions. The dark background ensures excellent readability in projector presentation environments.
-
Recommended For
Executives, marketing professionals, data analysts, consultants, and investor relations managers presenting market conditions, competitive analysis, and performance trends. Suitable for any business presentation requiring quarterly or annual performance comparisons.
-
Slide Structure
2-slide deck presenting the same graph layout in two color variations: blue-emphasized and yellow-emphasized. Each slide contains 12 data points across 4 years (2021–2024) × 3 items with horizontal bars, numerical labels, and legend clearly displayed for easy interpretation.
Related Products
-

Segmented Bar Graph for Market and Competitor Analysis
#Market and Competitor Analysis #Graph #Competitor Analysis
-

Market Analysis Graph Ahead of the Future – Innovative Business Insights
#Market and Competitor Analysis #Diagram #Graph
-

Business Partner Analysis Bar Graph – Market Insights
#Market and Competitor Analysis #Graph #Competitor Analysis
-

Segmented Graph of Learning Goal Achievement – Market and Competitor Analysis
#Market and Competitor Analysis #Graph #Competitor Analysis
