Body Organ Analysis Subdivision Graph - Market and Competitor Comparison
RJ0400045_12
- Last Update 05/29/2025
- File Size 3MB
- # of Slides 2
- File Format PPTX
- Slide Ratio 16:9
- Color
Keywords
- #Content-Based Slides
- #Design-Based Slides
- #Market and Competitor Analysis
- #Graph
- #Competitor Analysis
- #Market Analysis
- #Horizontal Bar
- #Segmented Horizontal Bar
- #16:9
- #subdivision bar chart PowerPoint
- #4-item stacked bar graph
- #market analysis slide template
- #competitor comparison chart
- #numerical data visualization PowerPoint
About the Product
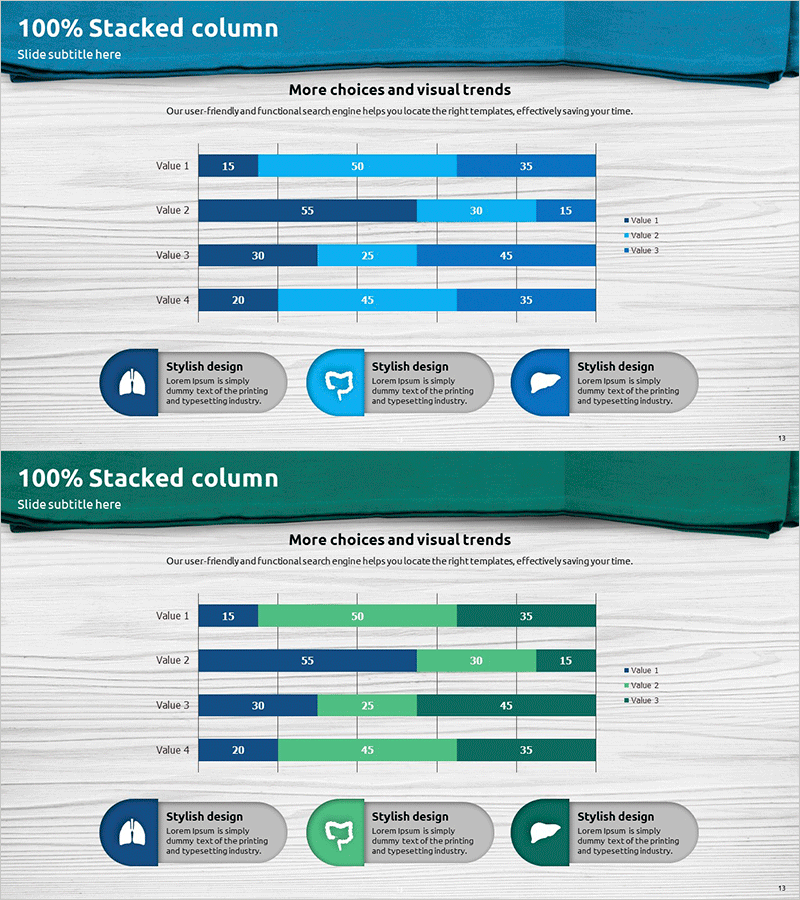
A subdivision bar chart PowerPoint slide that divides four items horizontally for comparative analysis. The slide uses dark blue, light blue, and green color schemes to distinguish each item while clearly expressing numerical data. This presentation template is ready to use for various situations including market analysis, competitor comparison, and product performance evaluation. Composed of 2 slides in 16:9 widescreen format, allowing you to freely edit text and numerical values for your specific needs.
Usage Points
-
Main Usage
This chart is optimized for comparing and analyzing numerical data across four items displayed horizontally in subdivided segments. It effectively presents multiple indicators simultaneously, such as market size, market share, and growth rates, or compares performance metrics across competitors. Each item displays 3-4 subdivided data points in stacked format, allowing viewers to understand both overall composition and individual proportions at a glance.
-
How to Use
Ideal for business presentations, marketing strategy meetings, sales presentations, and executive reports that require data-driven decision support. Simply enter your analysis topic in the title area at the top of the slide, then replace the numerical values and legend items with your actual data. The color differentiation makes it easy to convey category-specific information intuitively.
-
Recommended For
Recommended for marketing professionals, sales managers, business planning teams, consultants, and financial analysts who prepare data-driven reports. Particularly useful for quarterly performance analysis, market research presentations, competitive analysis reports, and product performance comparisons.
-
Slide Structure
Consists of 2 slides, each containing a 4-item horizontal subdivision bar chart. The first slide features a dark blue tone while the second offers a green tone variation. Each bar is divided into 3-4 subdivided segments with legend and numerical labels included. Formatted in 16:9 widescreen to optimize compatibility with modern projectors and digital displays.
Related Products
-

Space Industry Market Analysis Bar Graph – Providing Strategic Insights
#Market and Competitor Analysis #Graph #Competitor Analysis
-

Market Analysis Bar Graph – Effective Visualization for Competitor Analysis
#Market and Competitor Analysis #Graph #Competitor Analysis
-

Business Partner Analysis Bar Graph – Market Insights
#Market and Competitor Analysis #Graph #Competitor Analysis
-

Business Service Analysis Segmentation Graph – Ideal for Market and Competitor Analysis
#Market and Competitor Analysis #Graph #Competitor Analysis
