Musicians and Gauge Charts Slide – The Uniqueness of Data Visualization
RJ0500020_26
- Last Update 06/12/2025
- File Size 0.6MB
- # of Slides 2
- File Format PPTX
- Slide Ratio 16:9
- Color
Keywords
About the Product
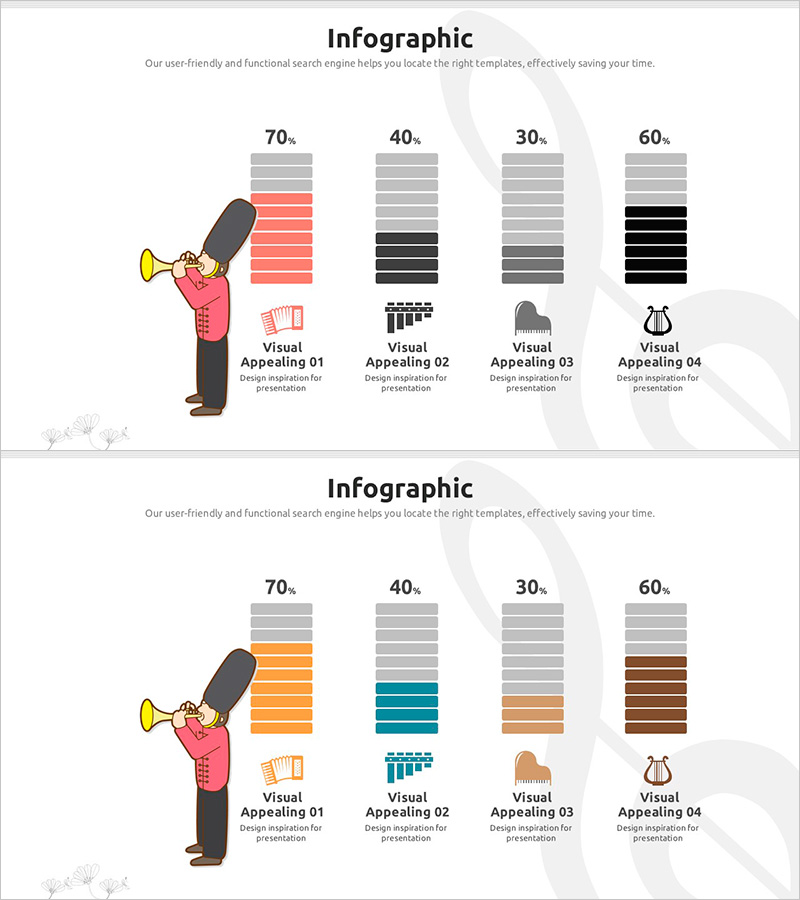
A multi-metric gauge chart PowerPoint slide designed to visualize performance indicators across music, marketing, and technology sectors. This presentation slide displays four gauges simultaneously showing 70%, 40%, 30%, and 60% metrics in red, black, gray, and brown color schemes. Each gauge is paired with a visual icon and descriptive text area below, enabling clear comparison of ROI, market share, achievement rates, and other quantitative data. Formatted in 16:9 widescreen PPTX, the slide is immediately editable and ideal for inserting into the analysis and performance sections of business presentations, financial reports, and investor pitches.
Usage Points
-
Main Usage
Simultaneously visualize up to four quantitative metrics—such as ROI, market share, achievement rate, and goal completion percentage—to support data-driven decision-making. The proportional fill of each gauge enables instant comparison of performance across departments, quarters, or business units, making it essential for financial reports, investor presentations, and executive briefings.
-
How to Use
Replace the default gauge values (70%, 40%, 30%, 60%) with your actual data, then update the icon labels and descriptive text to match your specific metrics. Adjust the color palette to align with your corporate brand guidelines. Insert the slide into the analysis, performance, or financial sections of your presentation to highlight key performance indicators and capture audience attention.
-
Recommended For
Finance teams presenting quarterly performance reports, executives delivering investor relations pitches, marketing teams analyzing campaign ROI, technical teams sharing project progress metrics, and business development professionals discussing market performance with stakeholders and partners.
-
Slide Structure
One title area, one subtitle text field, four gauge charts (displaying 70%, 40%, 30%, 60% respectively), four visual icons, and four label text areas. Each gauge includes an editable description field below for metric names, units, and additional context.
Related Products
-

Comparative Analysis Graph of Work Progress Status – Visual Data Insights
#Product/Service Introduction #Business Introduction #Diagram
-

Technology Achievement Donut Chart
#Product/Service Introduction #Business Introduction #Graph
-

Architectural Illustration Gauge Chart – Visualizing Technical Status
#Product/Service Introduction #Business Introduction #Graph
-

Infographic Slide for Performance Analysis – Clear Visualization
#Product/Service Introduction #Business Introduction #Graph
