Five Color PowerPoint Template Wide – Donut Chart
RJ0200009_7
- Last Update 03/30/2025
- File Size 4.8MB
- # of Slides 2
- File Format PPTX
- Slide Ratio 16:9
- Color
Keywords
- #Content-Based Slides
- #Design-Based Slides
- #Product/Service Introduction
- #Business Vision and Strategy
- #Graph
- #Other
- #Development Status
- #Business Background and Necessity
- #Circles
- #Doughnut Chart
- #Mockup
- #16:9
- #donut chart PowerPoint
- #pie chart slide template
- #ratio visualization PPT
- #data chart PowerPoint download
- #donut graph presentation slide
About the Product
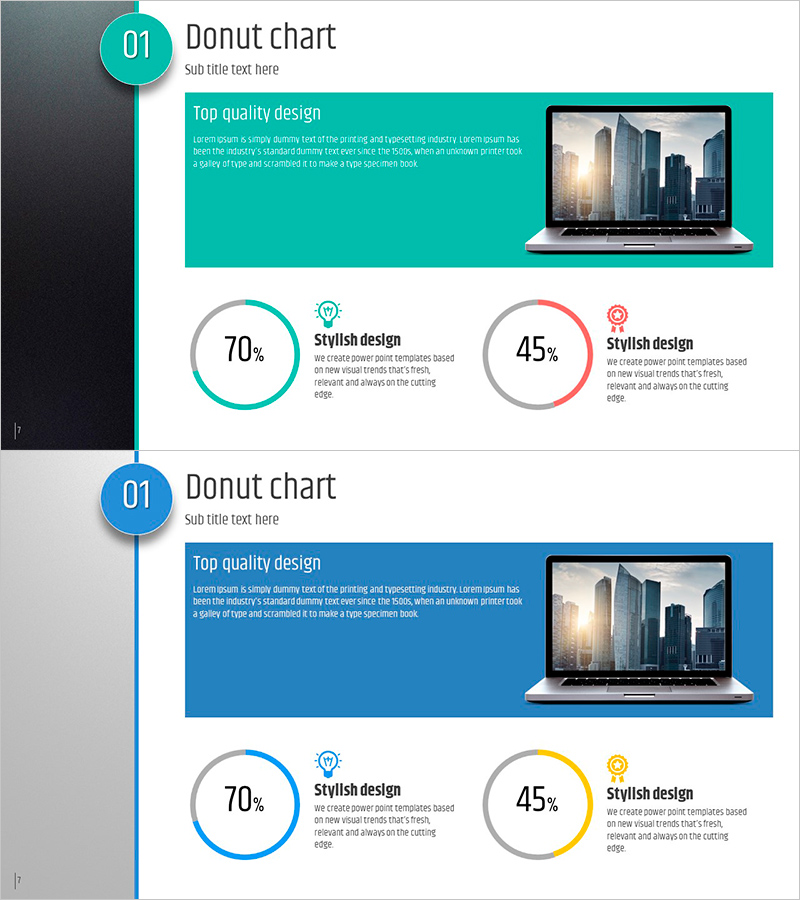
A professional donut chart PowerPoint slide for intuitive data ratio visualization. This 2-slide template features turquoise, gray, and pink color combinations that represent 70% and 45% ratio data, complemented by a laptop mockup image for premium presentation impact. Available in 16:9 widescreen PPTX format with full editing capability, this PowerPoint template is ideal for business analysis, marketing reports, performance reviews, and data-driven presentations across various industries.
Usage Points
-
Main Usage
This donut chart slide clearly expresses data ratios and composition structures. It is optimized for presentations requiring emphasis on parts-to-whole relationships, such as market share, customer satisfaction, budget allocation, and performance metrics.
-
How to Use
Slide 1 displays a 70% ratio on turquoise background; Slide 2 shows a 45% ratio on blue background. The laptop mockup image creates a professional presentation environment. All text, percentages, and labels are fully editable to match your actual data and branding requirements.
-
Recommended For
Ideal for executives, marketing teams, sales professionals, data analysts, and consultants presenting quarterly reports, strategy meetings, and client pitches. Perfect for situations where ratio-based decision-making requires strong visual impact and clear data communication.
-
Slide Structure
Two-slide layout with one donut chart per slide. Left side features the circular graph (70% and 45% ratio representation), right side includes laptop mockup image and descriptive text area in a two-column arrangement. Includes icon and 'Stylish design' label for visual emphasis.
Related Products
-

Online Business Marketing Strategy – Data-Driven Decision Making
#Product/Service Introduction #Marketing Plan and Strategy #Graph
-

Technology Achievement Donut Chart
#Product/Service Introduction #Business Introduction #Graph
-

Data Status Analysis Pie Chart – Intuitive Visualization
#Product/Service Introduction #Graph #Other
-

Plastic Surgery Data Analysis Donut Pie Chart Slide
#Product/Service Introduction #Graph #Other
