Performance Competitive Comparison Analysis Chart – Business Performance Analysis
RM0300014_17
- Last Update 02/10/2025
- File Size 1.2MB
- # of Slides 2
- File Format PPTX
- Slide Ratio 16:9
- Color
Keywords
- #Content-Based Slides
- #Design-Based Slides
- #Company Introduction
- #Market and Competitor Analysis
- #Diagram
- #Graph
- #Key Achievements
- #Competitor Analysis
- #Table
- #Horizontal Bar
- #Standard Table
- #Double Horizontal Bar
- #16:9
- #horizontal bar chart PowerPoint
- #performance comparison slide
- #competitive analysis template
- #dual-series chart PowerPoint
- #business performance visualization
About the Product
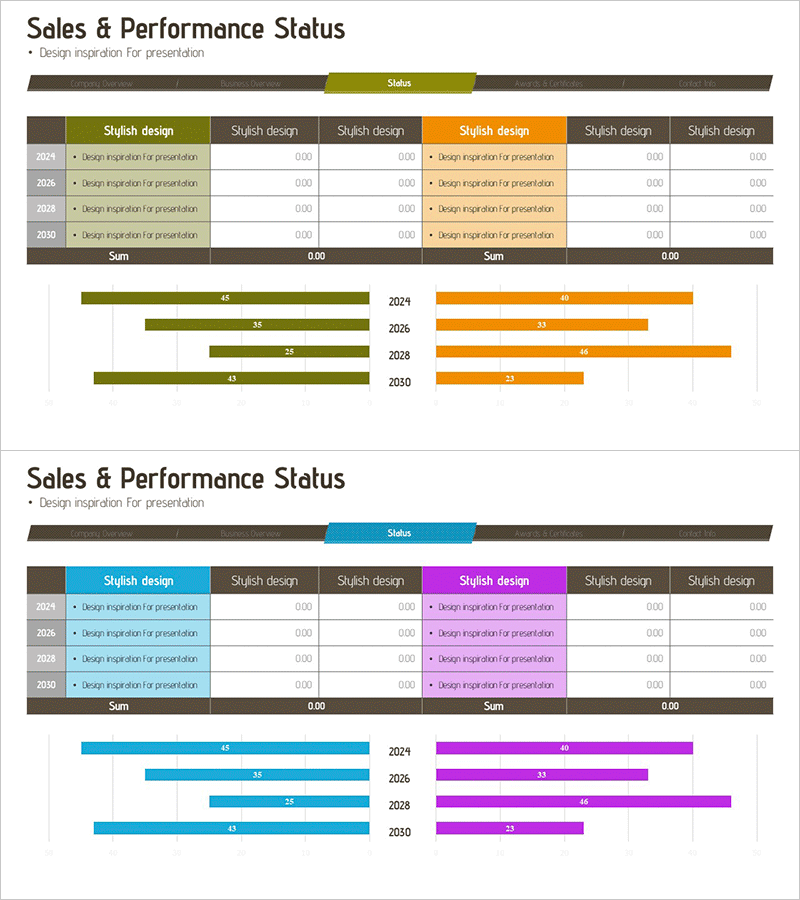
A horizontal bar chart PowerPoint slide designed to compare performance metrics and competitive data side by side. The slide features two data series in olive green and orange, enabling clear visualization of year-over-year performance trends and competitive positioning. Optimized for 16:9 widescreen format with 2-slide layout, this template is ready for business reports, quarterly performance presentations, executive briefings, and competitive analysis meetings. All data values and labels are fully editable for quick customization with your actual figures.
Usage Points
-
Main Usage
Compare year-over-year performance metrics and competitive benchmarks in a single view to assess market position and growth trajectory. The contrasting olive green and orange color scheme clearly distinguishes company data from competitor data, while numeric labels at the end of each bar ensure precise value communication.
-
How to Use
Ideal for quarterly and annual performance reviews, executive briefings, investor presentations, and strategic planning sessions. Simply replace the bar lengths and numeric values with your actual data, and adjust colors and fonts to match your corporate branding. The template supports quick customization without requiring advanced design skills.
-
Recommended For
CFOs, financial managers, business unit leaders, marketing and sales directors, business planning teams, and consultants who need data-driven decision-making tools. Particularly useful for quarterly performance reviews, competitive landscape analysis, goal-versus-actual reporting, and market positioning assessments.
-
Slide Structure
2-slide template featuring horizontal bar charts with dual data series (olive green and orange). Each slide includes a title area at the top, a central bar chart displaying 4 years of data (2024, 2026, 2028, 2030), and a summary section at the bottom. All numeric values and labels are editable text boxes for seamless data integration.
Related Products
-

Benchmarking with Bar Chart Comparison
#Market and Competitor Analysis #Diagram #Graph
-

Competitor Analysis and Competitive Advantage Visualization – Harmony of Green and Orange
#Market and Competitor Analysis #Diagram #Graph
-

Competitor Analysis Graphs & Tables – Delivering Market Insights
#Market and Competitor Analysis #Diagram #Graph
-

Four Color Infographic for Market Competitor Analysis – Highlighting Competitive Advantage
#Market and Competitor Analysis #Graph #Competitor Analysis
