Car Wide Template Bilateral Bar Graph
RJ0200044_21
- Last Update 04/10/2025
- File Size 2.8MB
- # of Slides 2
- File Format PPTX
- Slide Ratio 16:9
- Color
Keywords
- #Content-Based Slides
- #Design-Based Slides
- #Market and Competitor Analysis
- #Graph
- #Competitor Analysis
- #Competitive Advantage
- #Horizontal Bar
- #Double Horizontal Bar
- #16:9
- #bilateral bar chart PowerPoint
- #dual data comparison slide
- #market analysis chart
- #competitive analysis graph
- #horizontal bar chart PowerPoint slide template
About the Product
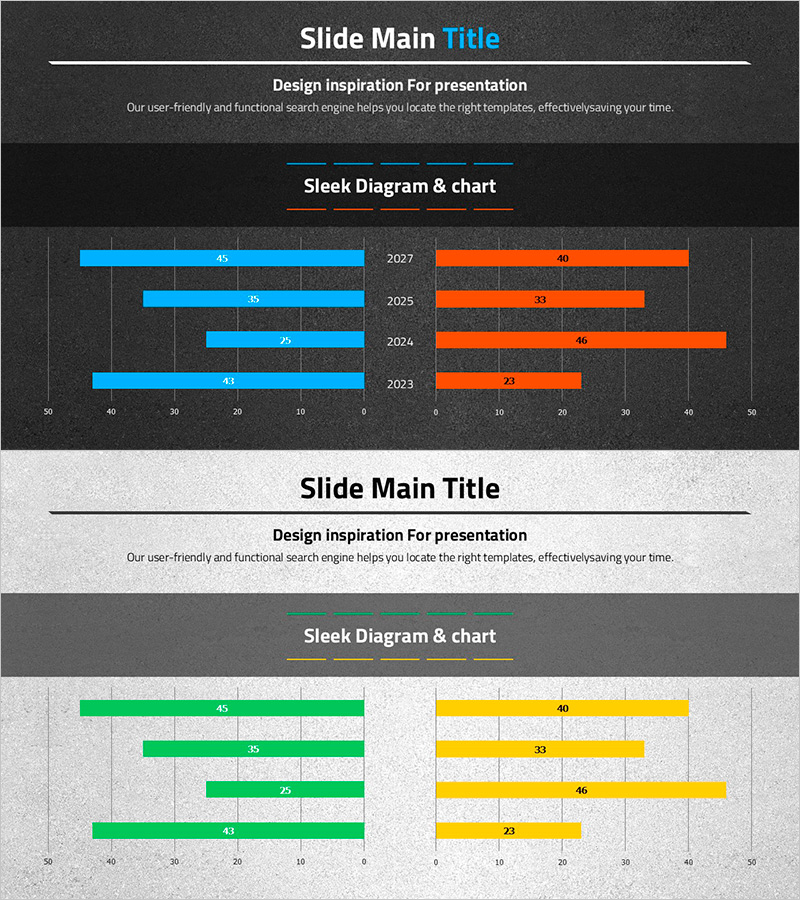
A bilateral horizontal bar chart PowerPoint slide that compares 4 years of data (2023–2027) in a left-right symmetrical structure. Blue and orange bar series contrast against a dark background, with numeric labels clearly displayed on each bar. Ideal for presentations requiring simultaneous visualization of dual datasets such as market analysis, competitive benchmarking, and performance comparisons. The 16:9 widescreen format includes 2 fully editable slides, suitable for automotive, manufacturing, financial, and other industry presentations.
Usage Points
-
Main Usage
Compares two data series side-by-side using a symmetrical bilateral bar structure. Visualizes market size comparisons, competitor performance benchmarks, budget vs. actual, target vs. achievement, and other dual-axis metrics with clarity and impact.
-
How to Use
Adjust the length of left (blue) and right (orange) bars for each year to input your data. Double-click numeric labels to replace with actual values. Customize bar colors to match your brand identity or corporate guidelines as needed.
-
Recommended For
Ideal for market analysis presentations in automotive, manufacturing, finance, and retail sectors; sales performance reports; competitive analysis materials; investor presentations; and strategic planning meetings. Particularly effective for executive briefings requiring objective comparison of two performance groups.
-
Slide Structure
2-slide deck featuring bilateral horizontal bar charts with 4 years of data (2023–2027) per slide. Each slide displays 4 blue bars (left) and 4 orange bars (right), representing 8 total data series with numeric labels on each bar.
Related Products
-

Competitive Comparison Analysis Bar Graph – Visualizing Market Advantage
#Market and Competitor Analysis #Graph #Competitor Analysis
-

Comparative Analysis of Sales of Camping Competitors – Insights and Comparisons
#Market and Competitor Analysis #Graph #Competitor Analysis
-

Bar Graph Comparing Exercise Performance by Group
#Market and Competitor Analysis #Graph #Competitor Analysis
-

Competitor Paired Bar Graph – Market Analysis and Comparison
#Market and Competitor Analysis #Graph #Competitor Analysis
