Business Competitor Analysis Graph
RJ0300002_18
- Last Update 04/19/2025
- File Size 14.1MB
- # of Slides 2
- File Format PPTX
- Slide Ratio 16:9
- Color
Keywords
- #Content-Based Slides
- #Design-Based Slides
- #Market and Competitor Analysis
- #Graph
- #Competitor Analysis
- #Competitive Advantage
- #Horizontal Bar
- #Double Horizontal Bar
- #16:9
- #diverging bar chart
- #competitor analysis PowerPoint
- #comparison chart slide
- #horizontal bar graph template
- #market analysis presentation
About the Product
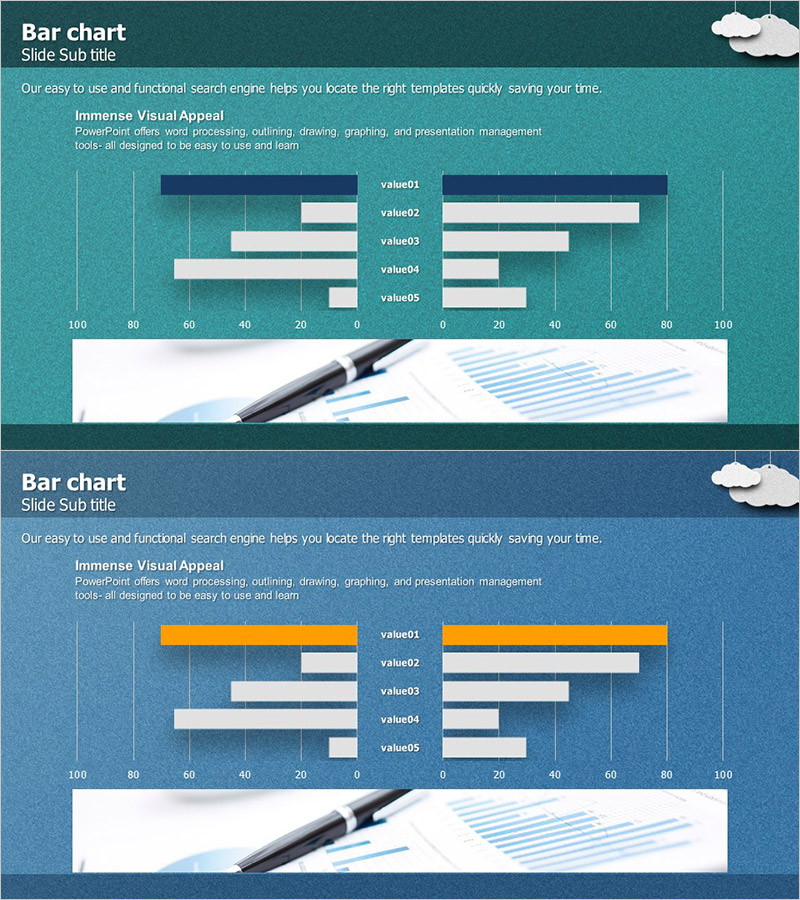
A diverging bar chart PowerPoint slide optimized for competitor analysis and market comparison. This presentation template features a symmetrical left-right structure that visualizes two companies' performance metrics simultaneously across five items (value01 through value05) using horizontal bars. The teal background contrasts with dark blue and light gray bars for clear data differentiation. Designed for immediate use in business presentations, strategy reports, and market analysis documents, this 2-slide set (16:9 aspect ratio) is fully editable.
Usage Points
-
Main Usage
Compares performance metrics of two companies or products using a symmetrical left-right bar structure. Ideal for competitive analysis, market share comparison, and performance benchmarking in business presentations requiring quantitative data visualization.
-
How to Use
Input metric names (revenue, market share, customer satisfaction, etc.) for each value item and adjust bar lengths to represent your data. The teal background and dark blue/gray bar colors are fully customizable to match corporate branding. Two slides allow you to create multiple comparison scenarios.
-
Recommended For
Recommended for strategy planning teams, marketing departments, and sales organizations presenting competitive analysis. Suitable for business plans, quarterly performance reports, investor presentations, and market entry strategy decks.
-
Slide Structure
Two-slide set, each featuring a symmetrical diverging bar chart with five items (value01–value05) arranged horizontally. Left bars display in dark blue, right bars in light gray, creating clear visual distinction between two subjects. Central axis with 100–0–100 scale provides intuitive comparison framework.
Related Products
-

Competitive Advantage 3D Bi-directional Bar Graph – Essential Tool for Market Analysis
#Market and Competitor Analysis #Graph #Competitor Analysis
-

Competitor Analysis Bilinear Bar Graph – Identify Market Advantage
#Market and Competitor Analysis #Graph #Competitor Analysis
-

Competitor Analysis Double Bar Graph – Visualizing Competitive Advantage
#Market and Competitor Analysis #Graph #Competitor Analysis
-

Competitor Analysis and Competitive Advantage Visualization – Harmony of Green and Orange
#Market and Competitor Analysis #Diagram #Graph
