Business Idea Development Status Graph – Ideas and Growth
RJ0300088_17
- Last Update 05/13/2025
- File Size 0.7MB
- # of Slides 2
- File Format PPTX
- Slide Ratio 16:9
- Color
Keywords
- #Content-Based Slides
- #Design-Based Slides
- #Product/Service Introduction
- #Market and Competitor Analysis
- #Graph
- #Development Status
- #Market Share
- #Circles
- #Doughnut Chart
- #16:9
- #donut chart PowerPoint
- #pie chart slide template
- #ratio comparison slide
- #circular chart template
- #how to create donut chart in PowerPoint
About the Product
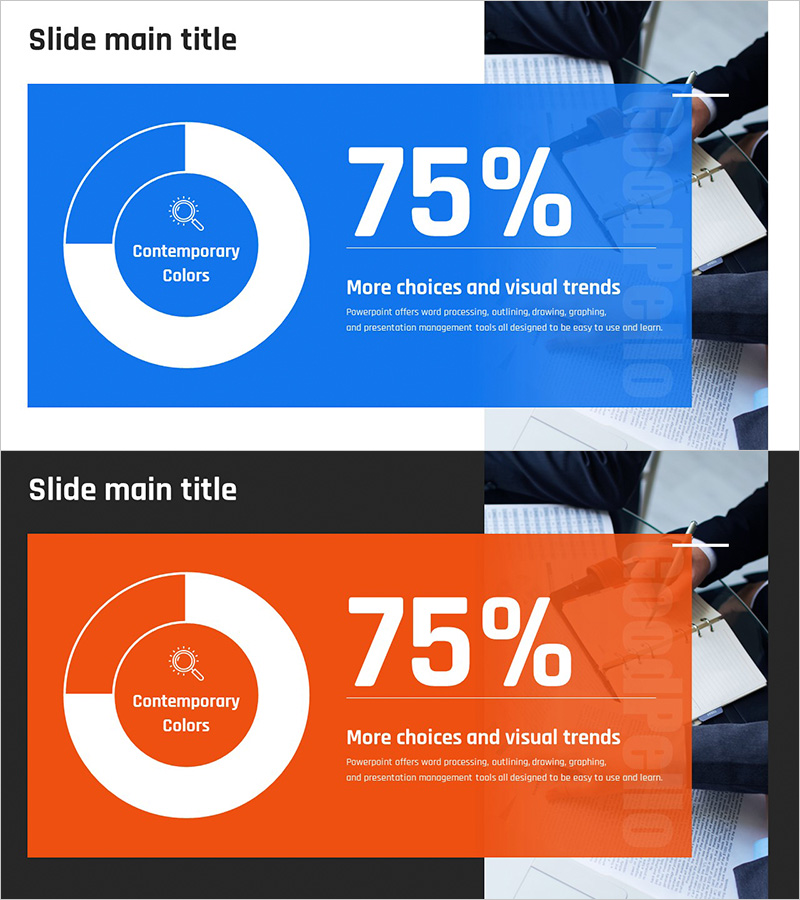
A professional donut chart PowerPoint slide designed to visualize business idea development status and market metrics. The two-color circular chart in blue and orange clearly represents data ratios, market share, growth rates, and comparative percentages. A centered icon and text area emphasize key messages, while the background image creates a polished business presentation. Delivered in 16:9 widescreen format with 2 fully editable slides ready for immediate use.
Usage Points
-
Main Usage
Visualize business metrics such as idea development progress, market share, growth rates, and category composition using a two-segment donut chart. The centered icon area highlights core messages and draws audience attention to key data points.
-
How to Use
Ideal for investor presentations, quarterly business reports, and marketing strategy meetings. Simply replace the blue and orange data values with your own figures, edit the center text and icon, and the slide is ready for presentation.
-
Recommended For
Executives, marketing managers, business strategists, and investors. Recommended for quantitative data comparisons in strategy meetings, performance reviews, new business proposals, and competitive analysis presentations.
-
Slide Structure
2-slide set. Each slide features one donut chart, one centered icon area, and one right-aligned text section. Includes two color variations – blue background and orange background – allowing you to match your presentation theme.
Related Products
-

Sales Status Analysis Graph – Simple and Stylish Design
#Product/Service Introduction #Market and Competitor Analysis #Graph
-

Stock Market Share Analysis Graph – Insights and Strategies
#Product/Service Introduction #Market and Competitor Analysis #Graph
-

Analysis graph of market share progress
#Product/Service Introduction #Market and Competitor Analysis #Graph
-

Analysis of Work Progress – Utilizing Pie Chart
#Product/Service Introduction #Market and Competitor Analysis #Graph
