Website Technology Development Status Graph – Market Share and Trends
RJ0400041_6
- Last Update 05/28/2025
- File Size 0.2MB
- # of Slides 2
- File Format PPTX
- Slide Ratio 16:9
- Color
Keywords
- #Content-Based Slides
- #Design-Based Slides
- #Product/Service Introduction
- #Market and Competitor Analysis
- #Graph
- #Development Status
- #Market Share
- #Circles
- #Doughnut Chart
- #16:9
- #donut chart PowerPoint slide
- #pie chart template
- #market share visualization
- #website technology presentation
- #data ratio chart
- #how to create donut chart in PowerPoint
About the Product
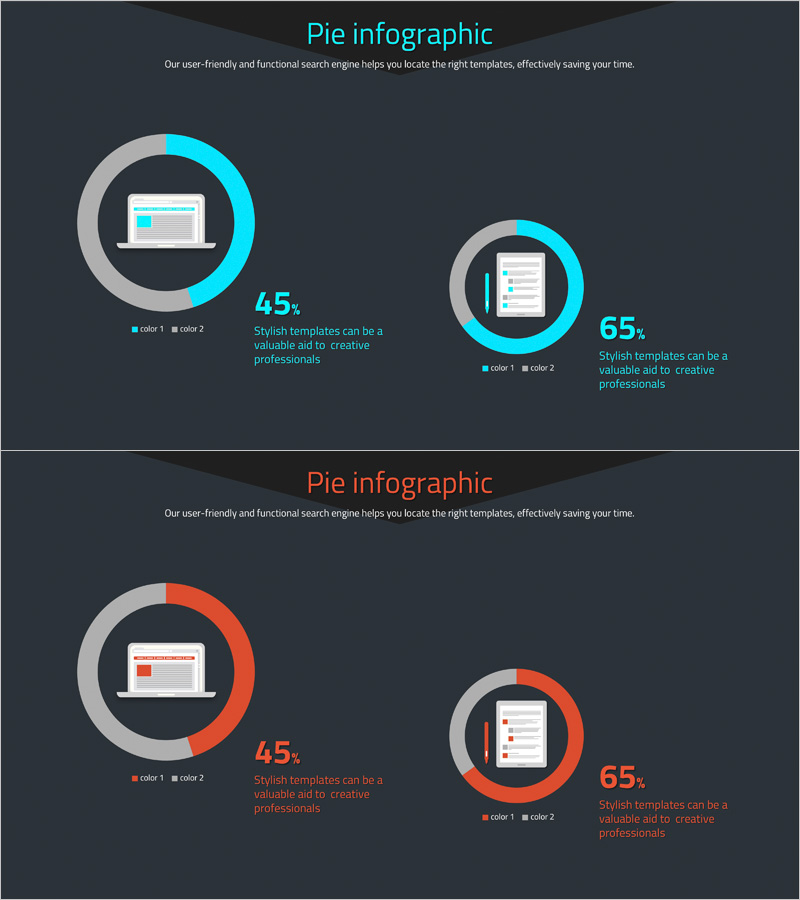
A PowerPoint slide featuring donut-shaped pie charts to visualize website technology development status and market share distribution. Two donut charts are positioned symmetrically in cyan and gray tones, each displaying data with 2-color legend indicators. The 16:9 widescreen format includes 2 slides ready for immediate use in presentations and reports. Laptop icons and infographic styling emphasize technology trends and user statistics, making data comparison intuitive and professional.
Usage Points
-
Main Usage
Visualize market share, user preference, and technology adoption rates using donut charts to enhance presentation credibility and readability. Ideal for technology trend analysis, competitive comparison, and development status reporting in business and technical presentations.
-
How to Use
Left chart represents technology A market share while right chart shows technology B, or compare year-over-year changes for the same technology. Edit legend colors and percentages to input actual data. Place in market analysis, technology overview, or executive briefing sections of your presentation.
-
Recommended For
IT professionals, web development team leads, product managers, marketing analysts, and executives presenting technology trends and market data. Suitable for investor pitch decks, business plans, quarterly technology status reports, and strategic planning presentations.
-
Slide Structure
2-slide set with symmetrically positioned donut charts on each slide. Each donut is segmented with 2-color schemes (cyan+gray, orange+gray) showing percentage values in center and legend with descriptive text on the right. 16:9 widescreen format optimized for modern presentation environments and large-screen displays.
Related Products
-

Analysis graph of market share progress
#Product/Service Introduction #Market and Competitor Analysis #Graph
-

Analysis of Work Progress – Utilizing Pie Chart
#Product/Service Introduction #Market and Competitor Analysis #Graph
-

Graph of Analysis of Transportation Development Status
#Product/Service Introduction #Market and Competitor Analysis #Graph
-

City Theme Market Share Graph – Business Data Visualization
#Product/Service Introduction #Market and Competitor Analysis #Graph
