Setting Goals for Area Graph Analysis – Business Development and Strategy
RJ0300081_27
- Last Update 05/11/2025
- File Size 1.6MB
- # of Slides 2
- File Format PPTX
- Slide Ratio 16:9
- Color
Keywords
- #Content-Based Slides
- #Design-Based Slides
- #Business Introduction
- #Marketing Plan and Strategy
- #Graph
- #Technological Status
- #Marketing Strategy
- #Other
- #Radar Chart Spider Chart
- #16:9
- #radial diagram PowerPoint
- #radial diagram slide template
- #strategy analysis diagram
- #goal-setting presentation slide
- #business development PowerPoint
- #how to create radial diagram in PowerPoint
About the Product
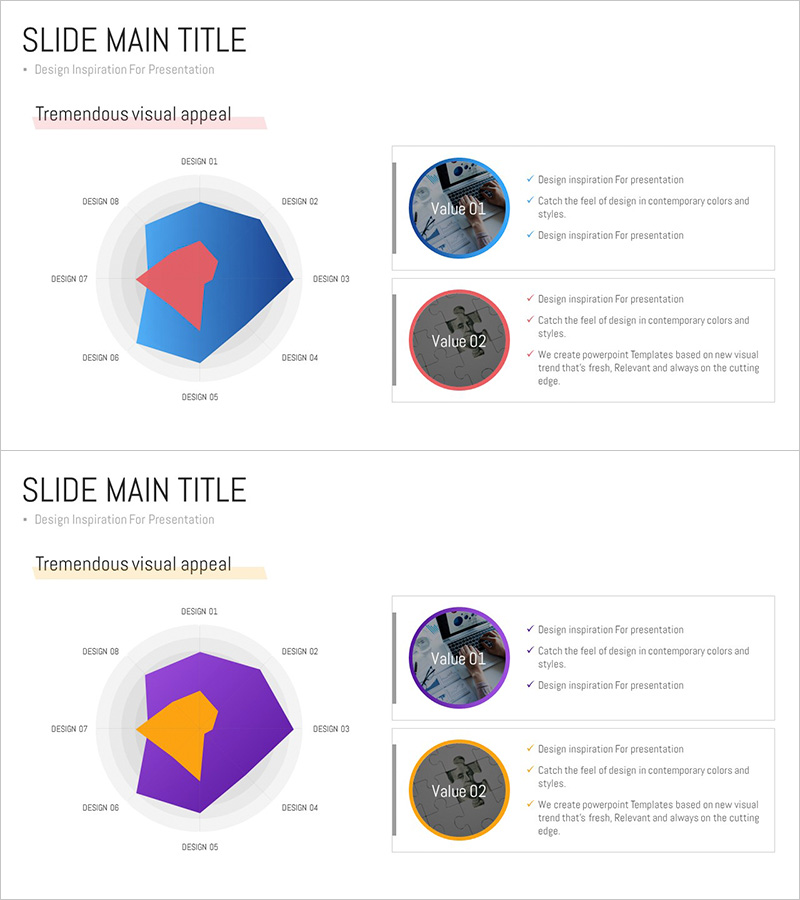
A radial diagram PowerPoint slide with eight directional branches extending from a central concept. The design uses contrasting blue and red color schemes to distinguish primary and secondary elements, with labels positioned at each radial point. This slide template is ideal for business development strategies, marketing analysis, goal-setting presentations, and multi-channel planning. The 2-slide set includes two color variations—blue tone and purple tone—allowing you to match your presentation's overall aesthetic. Fully editable PPTX format for immediate customization.
Usage Points
-
Main Usage
Visualizes strategic concepts, analyses, and goals that radiate outward from a central idea. Effectively represents business expansion directions, multi-channel marketing strategies, organizational role distribution, risk factor analysis, and any hierarchical information flowing from center to periphery.
-
How to Use
Enter your core concept in the center, then add item names and descriptions to the eight radial branches. Customize colors and sizes based on item importance. Select either the blue-tone or purple-tone slide to maintain consistent design throughout your presentation.
-
Recommended For
Business strategy presentations by planning teams, marketing channel analysis by marketing professionals, goal-setting sections in executive reports, analysis materials in consulting proposals, and concept explanation slides in educational seminars.
-
Slide Structure
Central circular shape with eight directional labels (top, bottom, left, right, and four diagonal positions). Each item is represented as a circular or hexagonal node connected to the center by lines. The 2-slide set provides two color variations: blue tone (blue center with red accents) and purple tone (purple center with orange accents).
Related Products
-

Sailing Travel Risk Management Radar Chart
#Product/Service Introduction #Business Introduction #Diagram
-

Type-specific Analysis Radial Graph – Business Status Visualization
#Business Introduction #Graph #Technological Status
-

Goal Setting & Radial Graph – Intuitive Data Visualization
#Business Introduction #Market and Competitor Analysis #Diagram
-

Data Analysis Radial Graph for Performance Visualization – Trust and Professionalism
#Product/Service Introduction #Business Introduction #Diagram
