



Cloud System Configuration Analysis – Insights into Technology Status
RJ0400059_23
- Last Update 06/03/2025
- File Size 2MB
- # of Slides 2
- File Format PPTX
- Slide Ratio 16:9
- Color
Keywords
- #Content-Based Slides
- #Design-Based Slides
- #Business Introduction
- #Technical Approach
- #Graph
- #Technological Status
- #System Architecture Diagram
- #Other
- #Radar Chart Spider Chart
- #16:9
- #radial diagram PowerPoint
- #cloud system architecture slide
- #IT technology presentation
- #cloud network diagram template
- #how to create cloud infrastructure diagram in PowerPoint
About the Product
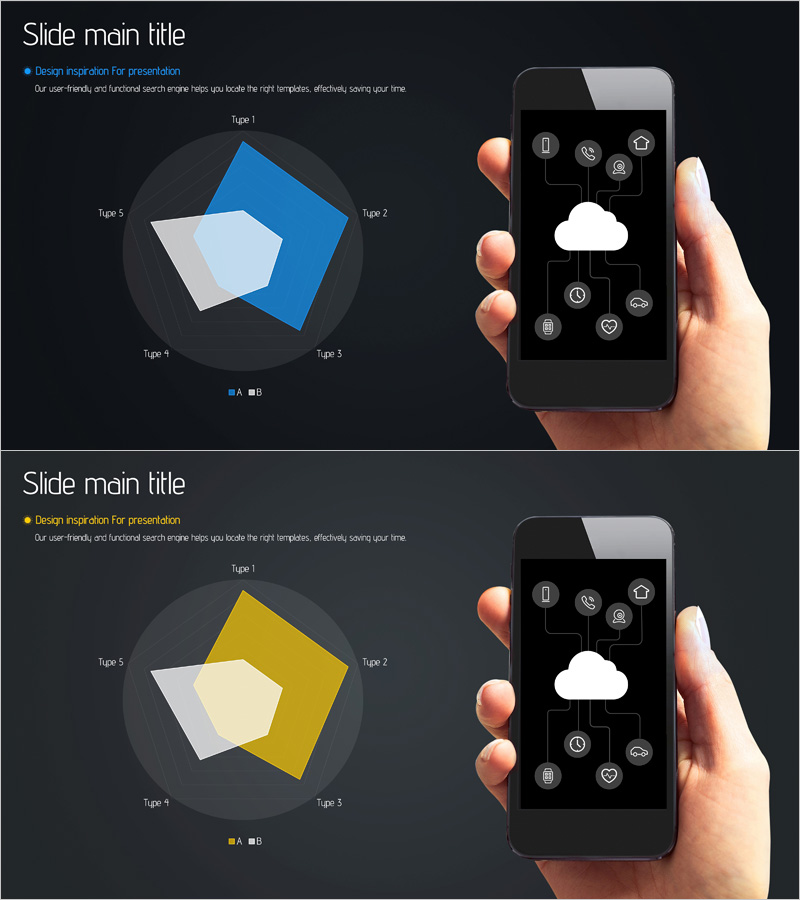
A radial diagram PowerPoint slide that visualizes cloud technology architecture with a central hub expanding outward to five peripheral nodes. The dark background features blue primary nodes and light gray secondary nodes arranged hierarchically, enabling intuitive communication of technical infrastructure. This presentation slide clearly displays core cloud system components and their interconnections at a glance, making it ideal for IT technology presentations, business introductions, and technical proposals. The 2-slide set includes color variations in blue and yellow tones, allowing you to select the best option for different presentation contexts.
Usage Points
-
Main Usage
Clearly represents the central cloud technology components and their peripheral connections using a radial structure. Enhances audience comprehension during technology status analysis, system architecture explanations, and IT solution proposals by visually mapping the core technology stack.
-
How to Use
Apply this diagram slide in IT technology presentations, cloud solution proposals, technical status reports, and business introduction decks. Enter core technology names in the central node and detailed components in surrounding nodes to complete your technical relationship diagram.
-
Recommended For
IT technology teams, cloud solution managers, technical planners, development leaders, system architects, and technical sales professionals presenting technology status, infrastructure deployment plans, and cloud migration strategies.
-
Slide Structure
Central circular node (cloud system core) with five directional nodes radiating outward. Primary nodes in blue or yellow tones, secondary nodes in light gray for visual distinction. Dark background with white text labels identifying each node's function. Two-slide set with color variations.
Related Products
-
Data Analysis Radial Graph for Performance Visualization – Trust and Professionalism
#Product/Service Introduction #Business Introduction #Diagram
-
Type-specific Analysis Radial Graph – Business Status Visualization
#Business Introduction #Graph #Technological Status
-
Learning Flow Across Five Key Areas - Multidirectional Tool
#Business Introduction #Technical Approach #Diagram
-
Business Operation Management Plan – Latest Technology System Diagram
#Business Introduction #Technical Approach #Diagram