Sailing Travel Risk Management Radar Chart
RJ0600072_19
- Last Update 07/09/2025
- File Size 0.3MB
- # of Slides 2
- File Format PPTX
- Slide Ratio 16:9
- Color
Keywords
- #Content-Based Slides
- #Design-Based Slides
- #Product/Service Introduction
- #Business Introduction
- #Diagram
- #Graph
- #Features
- #Technological Status
- #Cluster
- #Other
- #Chain Diagram
- #Radar Chart Spider Chart
- #16:9
- #radial radar chart PowerPoint
- #5-axis radar diagram template
- #risk management slide
- #data comparison chart
- #how to create radar chart in PowerPoint
About the Product
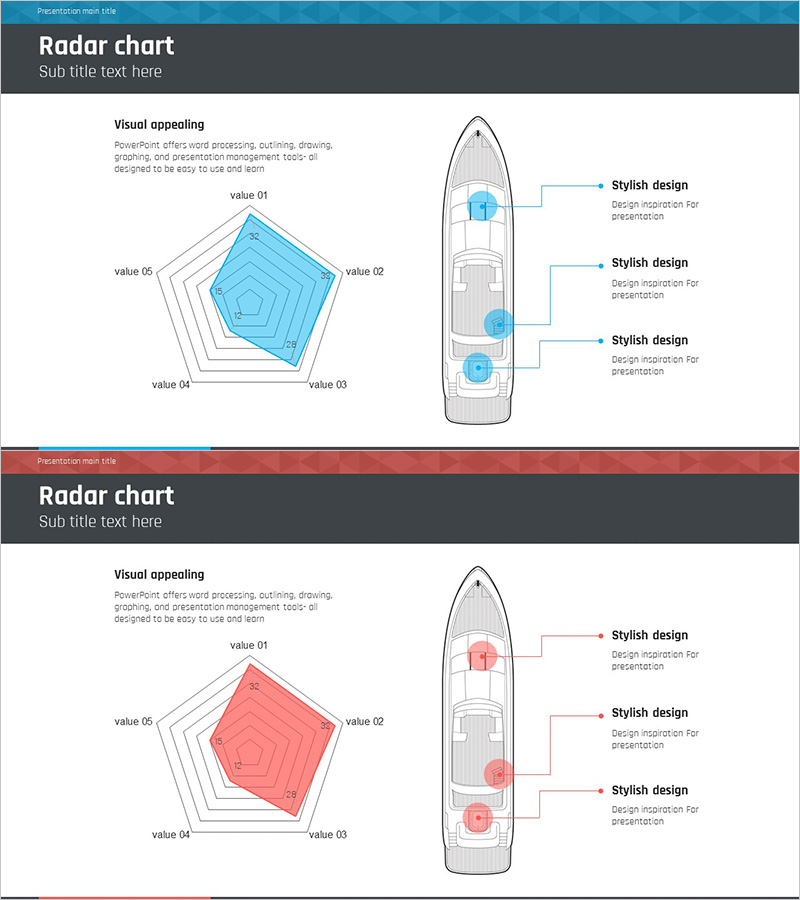
A 5-axis radial radar chart PowerPoint slide designed for maritime travel and risk management presentations. This 2-slide template features contrasting blue and red color schemes, allowing you to input risk factors across five axes (value 01–05) for comprehensive multi-data comparison at a glance. The right side includes a boat mockup illustration and three callout text boxes for detailed explanations of each risk area. This data visualization template is ready for immediate use in professional presentations and reports.
Usage Points
-
Main Usage
Simultaneously compare multiple risk factors (safety, cost, timeline, environment, technology) across five axes in maritime, travel, and operations sectors. The blue slide represents baseline conditions while the red slide illustrates risk escalation, enabling before/after comparative risk analysis and comprehensive risk level visualization.
-
How to Use
Input risk factor names and numerical values into each axis (value 01–05), then populate the three callout text boxes on the right with detailed explanations and mitigation strategies for each area. The boat mockup illustration reinforces industry context, and sequential placement of both slides creates dynamic risk progression visualization.
-
Recommended For
Maritime and shipping risk management reports, cruise line and travel agency safety briefings, project risk assessment meetings, executive-level risk factor analysis presentations, consulting reports requiring data visualization, and operational risk communication in logistics and marine industries.
-
Slide Structure
2-slide set. Each slide features a 5-axis radial radar chart (1 central vertex + 5 axis nodes) with a boat mockup illustration on the right (3 highlighted areas) and three callout text boxes for custom descriptions. First slide uses blue tone, second slide uses red tone to visually represent risk level escalation through color contrast.
Related Products
-

Visual Overview of Key Architectural Concepts – Representation of Core Technologies
#Product/Service Introduction #Business Introduction #Diagram
-

Data Analysis Radial Graph for Performance Visualization – Trust and Professionalism
#Product/Service Introduction #Business Introduction #Diagram
-

Comparable Filled Radial Chart – Intuitive Data Analysis
#Product/Service Introduction #Market and Competitor Analysis #Diagram
-

Online Shopping Mall System Radial Graph – Dynamic Data Visualization
#Business Introduction #Market and Competitor Analysis #Graph
