Big Data Development Status Radial Graph – Captivating Visual Appeal
RJ0400053_14
- Last Update 06/01/2025
- File Size 0.2MB
- # of Slides 2
- File Format PPTX
- Slide Ratio 16:9
- Color
Keywords
- #Content-Based Slides
- #Design-Based Slides
- #Product/Service Introduction
- #Business Introduction
- #Diagram
- #Graph
- #Development Status
- #Technological Status
- #Table
- #Other
- #Standard Table
- #Radar Chart Spider Chart
- #16:9
- #radial graph PowerPoint
- #radial chart template
- #big data presentation slide
- #multi-axis data visualization
- #technology status report
About the Product
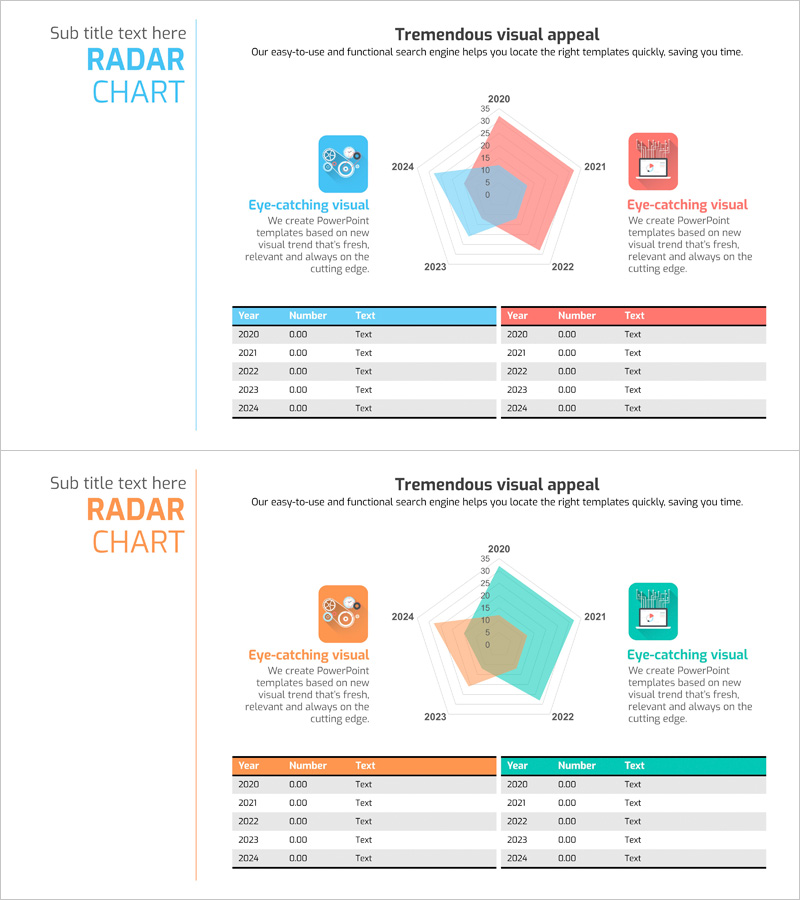
A radial chart PowerPoint slide that visualizes big data development status across five axes. This presentation template features a central concept with five directional branches, enabling simultaneous comparison of technical metrics, development progress, and performance indicators. The design uses pastel tones in pink, blue, and beige, with data points marked along each axis by year. The 2-slide set includes multiple color variations of radial charts, making it immediately applicable for technology reports, project status presentations, and data analytics slideshows.
Usage Points
-
Main Usage
Compares and visualizes big data, AI, and cloud development status across five or more metrics simultaneously. The radial structure radiating from a central concept allows viewers to grasp relationships and proportions of multiple data items at a glance.
-
How to Use
Use in technology reports, project status presentations, and data analytics seminars to explain development status, performance metrics, and investment progress. Customize axis labels and values to match your specific data requirements.
-
Recommended For
IT and software development teams / Data analytics departments / Technology executives / R&D managers / Consulting firms / Startup investor presentations / Technology conference speakers
-
Slide Structure
2-slide set. Slide 1: Pink and blue dual-tone 5-axis radial graph with data points from 2020–2024. Slide 2: Orange and turquoise dual-tone 5-axis radial graph with identical structure and color variation. Each axis is independently editable with legend and data labels included.
Related Products
-

Goal Setting & Radial Graph – Intuitive Data Visualization
#Business Introduction #Market and Competitor Analysis #Diagram
-

Big Data Development Status Analysis Graph – Visualizing Business Strategy
#Product/Service Introduction #Business Introduction #Diagram
-

Mobile Development Status Analysis Graph – Market Analysis and Competitiveness
#Product/Service Introduction #Market and Competitor Analysis #Diagram
-

Orange Green 4 Pie Charts – Technology Status and Development
#Product/Service Introduction #Business Introduction #Graph
