Onion Ingredients and Analysis Charts - Data Visualization in Food Industry
RJ0600046_9
- Last Update 07/03/2025
- File Size 0.9MB
- # of Slides 2
- File Format PPTX
- Slide Ratio 16:9
- Color
Keywords
- #Content-Based Slides
- #Design-Based Slides
- #Product/Service Introduction
- #Business Strategy
- #Diagram
- #Graph
- #Other
- #Development Status
- #Achievements
- #Table
- #16:9
- #food industry data visualization PowerPoint
- #analysis chart slide template
- #ingredient component comparison table
- #onion data PPT
- #comparative chart slide design
About the Product
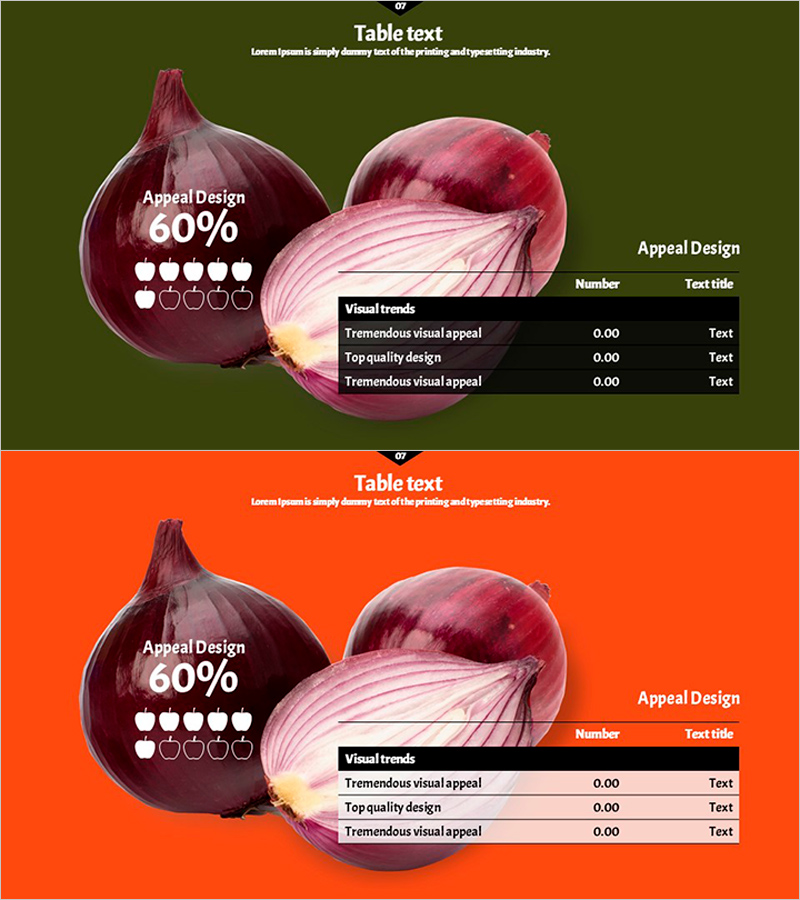
A 2-slide PowerPoint presentation optimized for food industry data visualization and ingredient analysis. Features onion component data displayed through a 60% gauge chart, rating icons, and numerical data table, set against olive green and orange backgrounds for enhanced readability. Combines actual ingredient imagery with quantitative metrics, making it immediately applicable to business presentations, reports, and marketing proposals. Designed in 16:9 widescreen format for modern presentation environments, with balanced layout of text, numbers, and visual elements to capture audience attention effectively.
Usage Points
-
Main Usage
Used for product component analysis, nutritional value comparison, and market data presentations by food and agricultural companies. Enables credible information delivery to investors, buyers, and consumers by combining qualitative descriptions with quantitative metrics.
-
How to Use
Slide 1 emphasizes key metrics using ingredient image, 60% gauge chart, and rating icons. Slide 2 presents detailed figures in a Visual trends data table. Text and numerical values are fully editable, allowing quick adaptation to other ingredients or product datasets.
-
Recommended For
Recommended for food, beverage, and agricultural companies preparing business plans, product introductions, marketing proposals, and investor presentations. Suitable for nutrition, food science, and quality assurance departments presenting analysis results, buyer meetings, and consumer education materials.
-
Slide Structure
Slide 1: Title area + ingredient image + 60% gauge chart + 5-level rating icons + text description zone. Slide 2: Title + 3-row data table (Visual trends, numerical values, text descriptions). Olive and orange backgrounds maintain visual consistency across both slides.
Related Products
-

Financial Performance and Forecast – Diagram for Business Strategy
#Business Strategy #Financial Plans and Performance #Diagram
-

Real Estate Contract Trend Analysis Chart – Visual Data for Business Success
#Business Introduction #Business Strategy #Diagram
-

Idea Development Analysis Chart – Data-Driven Innovation
#Product/Service Introduction #Business Introduction #Diagram
-

Musicians and Gauge Charts Slide – The Uniqueness of Data Visualization
#Product/Service Introduction #Business Introduction #Graph
