Participation Rate and Exercise Schedule – Efficient Operations Plan
RJ0600013_10
- Last Update 06/24/2025
- File Size 1.7MB
- # of Slides 2
- File Format PPTX
- Slide Ratio 16:9
- Color
Keywords
- #Content-Based Slides
- #Design-Based Slides
- #Operational Plan
- #Market and Competitor Analysis
- #Diagram
- #Graph
- #Other
- #Project Implementation Schedule
- #Customer Analysis
- #Table
- #Standard Table
- #16:9
- #dual arrow timeline PowerPoint slide
- #schedule table template
- #participation rate graph PPT
- #project timeline diagram
- #operational planning slide template
About the Product
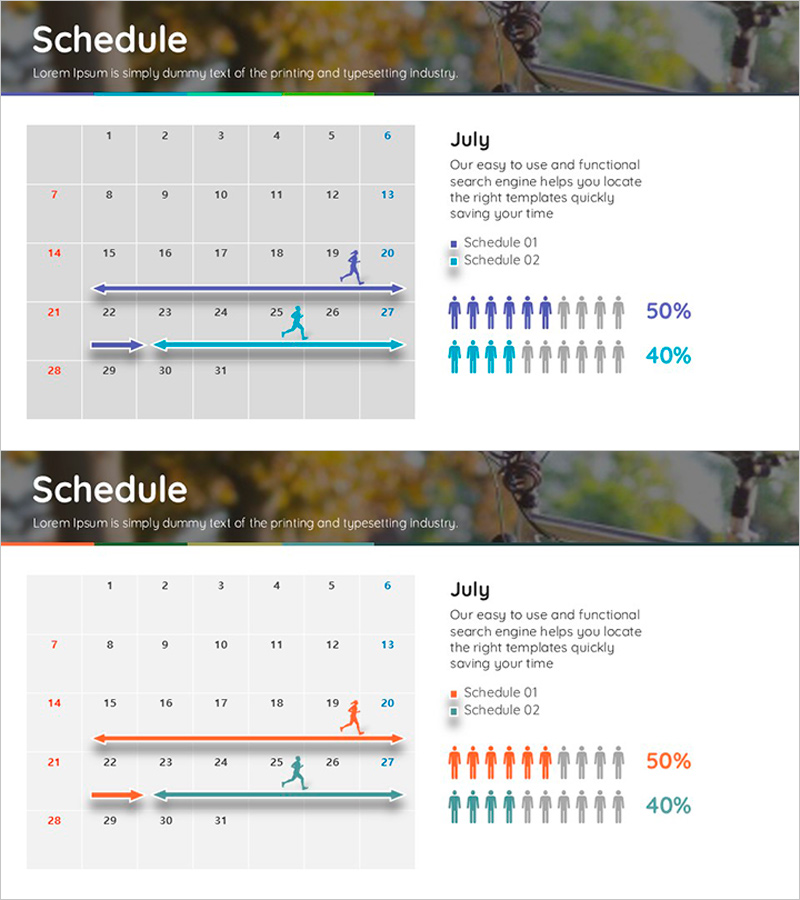
A PowerPoint slide that visualizes exercise schedules and participation rates side by side. The design features a calendar grid with two bidirectional arrows representing dual timelines, complemented by a people-icon graph and legend on the right. The blue and cyan color scheme clearly distinguishes schedule phases, making it ideal for project timeline management, team participation tracking, and operational planning. Delivered as a 2-slide set in 16:9 widescreen format, ready for immediate use in business presentations.
Usage Points
-
Main Usage
This slide simultaneously visualizes project schedules and team participation rates. A calendar-based timeline with bidirectional arrows represents two schedule phases, while a people-icon graph intuitively conveys participation percentages (50%, 40%, etc.). Ideal for operational planning, progress reporting, and team performance analysis.
-
How to Use
Enter actual dates in the left calendar grid and adjust arrow positions to mark schedule phases. Modify the number of people icons or change colors to update participation data. Replace legend text (Schedule 01, 02) with project or team names for immediate presentation use.
-
Recommended For
Project managers, team leaders, and operations coordinators presenting weekly or monthly schedules and team participation to executives. Applicable across industries including marketing campaign management, product launch timelines, and educational program operations.
-
Slide Structure
Both slides feature identical layout: 7×6 calendar grid on the left (dates 1–31), two bidirectional arrows (blue and cyan) in the center representing timeline phases, and a legend with people-icon graph on the right (10 icons with partial fill to represent percentages). 16:9 widescreen format.
Related Products
-

Male and Female Analysis Graphs and Tables – Gender Statistics Visualization
#Market and Competitor Analysis #Diagram #Graph
-

Businessperson Work Ability Analysis Graph – Successful Ability Assessment
#Product/Service Introduction #Market and Competitor Analysis #Diagram
-

Customer Analysis Donut Chart - Visualizing Market Share
#Market and Competitor Analysis #Graph #Other
-

Core Technologies of AI Chipsets: Performance Characteristics
#Market and Competitor Analysis #Diagram #Graph
