Camera Shooting App Analysis Graph – Visualization and Insights
RJ0400054_17
- Last Update 06/01/2025
- File Size 1.5MB
- # of Slides 2
- File Format PPTX
- Slide Ratio 16:9
- Color
Keywords
- #Content-Based Slides
- #Design-Based Slides
- #Product/Service Introduction
- #Market and Competitor Analysis
- #Graph
- #Other
- #Development Status
- #Market Analysis
- #Horizontal Bar
- #Segmented Horizontal Bar
- #Mockup
- #16:9
- #smartphone mockup PowerPoint
- #app analysis chart slide
- #horizontal bar graph template
- #mobile app market analysis presentation
- #data visualization slides download
About the Product
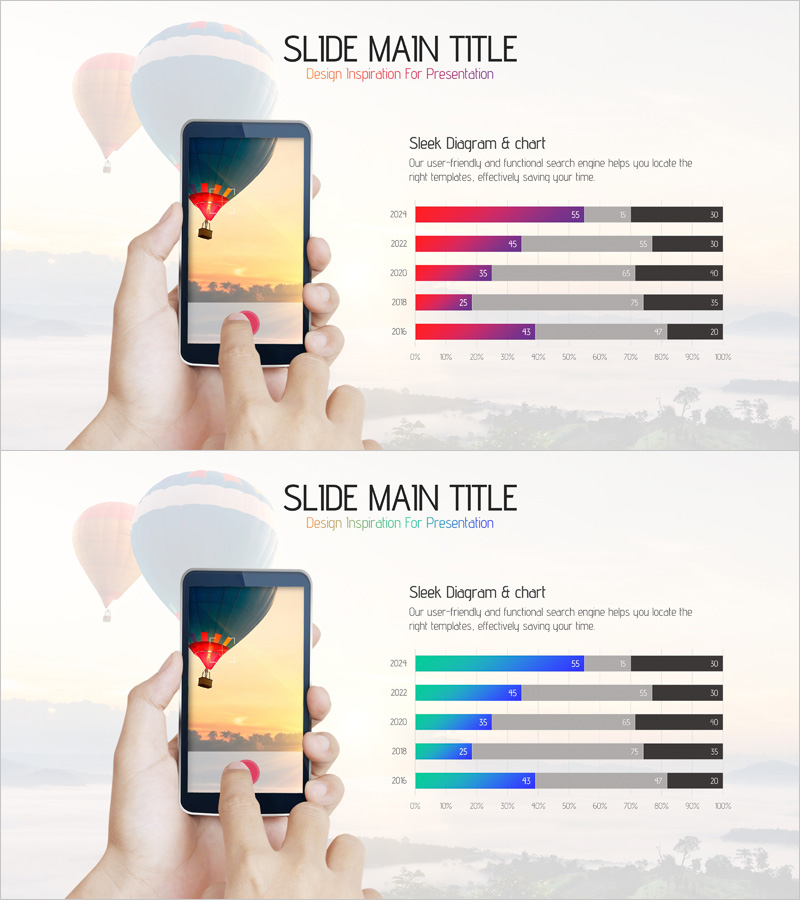
Mobile app analysis data visualization PowerPoint slide featuring smartphone mockup design. This 2-slide presentation combines a realistic smartphone device mockup with horizontal bar charts displaying year-over-year performance metrics from 2016 to 2024. The chart uses a four-color palette (red, purple, gray, black) to distinguish multiple data series, making it ideal for app market analysis, competitive benchmarking, and user behavior presentations. Delivered in 16:9 widescreen PPTX format with fully editable elements—customize numbers, colors, labels, and layout to match your app analytics data and presentation needs.
Usage Points
-
Main Usage
Visualize mobile app performance metrics, user growth trends, market share, and revenue data across multiple years using a realistic smartphone device mockup paired with horizontal bar charts to deliver clear, actionable insights in app marketing pitches, investor presentations, and executive reports
-
How to Use
Slide 1 displays a smartphone mockup with app interface content; Slide 2 presents a horizontal bar chart comparing 5 years of performance data across 4 metrics. Replace sample data, years, and labels with your actual app analytics to create a customized presentation
-
Recommended For
App development marketing teams, mobile product managers, venture capital investors, app store optimization (ASO) strategists, market research analysts presenting app performance metrics, user acquisition trends, competitive positioning, and revenue forecasts
-
Slide Structure
Slide 1: Hand-held smartphone device mockup with app screen content / Slide 2: Horizontal bar chart with 5 years (2024, 2022, 2020, 2018, 2016) displayed in 4-color series (red, purple, gray, black), 0–100% percentage scale axis
Related Products
-

Bar Graph Visualization of Workplace Preferences
#Product/Service Introduction #Market and Competitor Analysis #Graph
-

Business Area Analysis Graph & PC Mockup
#Technical Approach #Market and Competitor Analysis #Graph
-

Development Analysis Donut Graph – Visual Data Presentation
#Product/Service Introduction #Market and Competitor Analysis #Graph
-

Pie Chart Slide for Status of Service Technology Development
#Product/Service Introduction #Market and Competitor Analysis #Graph
