Development Analysis Donut Graph – Visual Data Presentation
RM0200012_17
- Last Update 02/04/2025
- File Size 0.4MB
- # of Slides 2
- File Format PPTX
- Slide Ratio 16:9
- Color
Keywords
- #Content-Based Slides
- #Design-Based Slides
- #Product/Service Introduction
- #Market and Competitor Analysis
- #Graph
- #Development Status
- #Market Analysis
- #Horizontal Bar
- #Circles
- #Segmented Horizontal Bar
- #Doughnut Chart
- #16:9
- #donut chart PowerPoint slide
- #pie chart template
- #data ratio visualization
- #4-series chart
- #business analysis slide
- #how to create donut chart in PowerPoint
About the Product
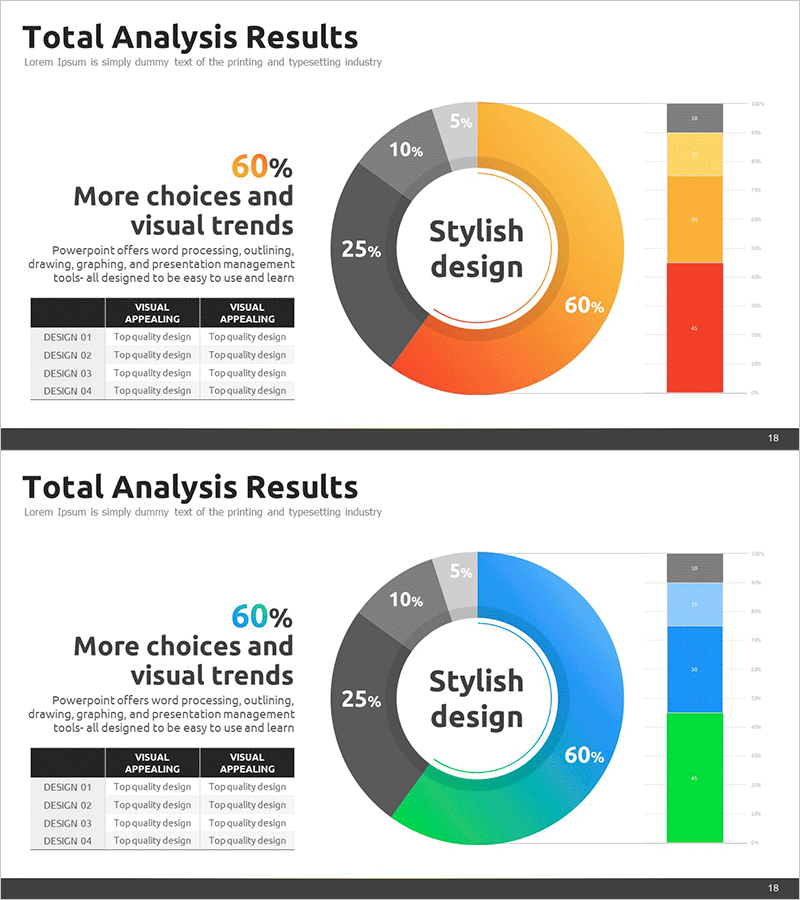
A professional donut chart PowerPoint slide designed to present development analysis and market insights through visual data representation. The slide features a 4-series donut chart with a central key metric, using distinct color coding (orange, red, blue, gray) to differentiate data segments and enhance readability. A complementary vertical bar chart on the right side enables detailed numerical comparison. The 2-slide set provides flexible layouts for immediate use in business presentations, reports, and analytical discussions.
Usage Points
-
Main Usage
Visualize proportional relationships such as development progress, market share, budget allocation, and customer composition. The centered key metric draws audience focus, while color-differentiated segments make each data category's proportion immediately clear and comparable.
-
How to Use
Slide 1 presents the overall composition via donut chart with supporting vertical bar chart for detailed figures. Slide 2 applies alternative data sets for comparative analysis or sequential presentation of quarterly or annual trends. Easily customizable for different data scenarios.
-
Recommended For
Executive reports, business analysis presentations, marketing status updates, financial reporting, and project progress reviews. Ideal for executives, team leaders, data analysts, and consultants who need data-driven decision-making visuals.
-
Slide Structure
Slide 1: Title area + centered donut chart (4 data series) + right-aligned vertical bar chart (4 items). Slide 2: identical layout for alternative datasets. 16:9 widescreen format, PPTX file type compatible with all modern PowerPoint versions.
Related Products
-

Camera Shooting App Analysis Graph – Visualization and Insights
#Product/Service Introduction #Market and Competitor Analysis #Graph
-

Mobile Development Status Analysis Graph – Market Analysis and Competitiveness
#Product/Service Introduction #Market and Competitor Analysis #Diagram
-

Port Transport Data & Comparison Chart – Optimized for Market and Competitor Analysis
#Product/Service Introduction #Market and Competitor Analysis #Graph
-

Hexagon Diagram & Horizontal Bar Graph – Elevating Visual Appeal
#Product/Service Introduction #Market and Competitor Analysis #Graph
