Target Market Map for the US Space Industry – Market Analysis Slide
RJ0700002_14
- Last Update 07/21/2025
- File Size 1.7MB
- # of Slides 2
- File Format PPTX
- Slide Ratio 16:9
- Color
Keywords
- #Content-Based Slides
- #Design-Based Slides
- #Market and Competitor Analysis
- #Graph
- #Other
- #Market Share
- #Target Market
- #Circles
- #Doughnut Chart
- #16:9
- #pie chart PowerPoint slide
- #market analysis presentation template
- #geographic map visualization
- #donut chart slide design
- #space industry market analysis PPT
About the Product
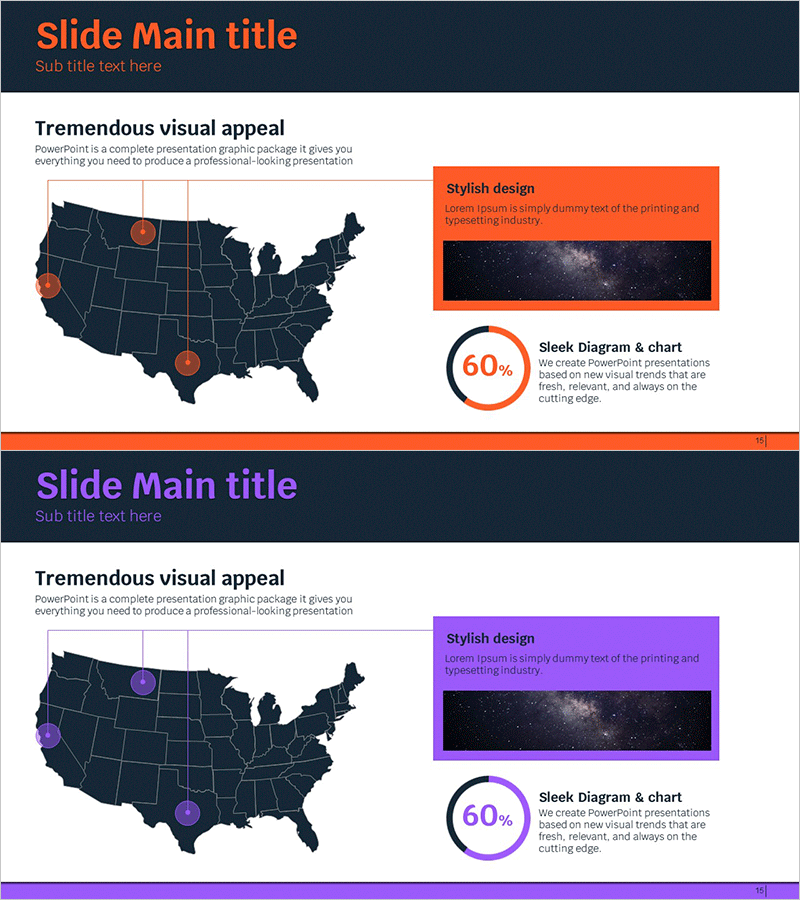
A 2-slide PowerPoint presentation set designed for analyzing the US space industry market using pie chart visualization. Features a dark navy background with orange accent colors, combining a geographic map visualization with a 60% donut chart to clearly represent market share, regional distribution, and industry segments. Information boxes and text elements highlight key insights, optimized for 16:9 widescreen format in modern presentation environments. Ready-to-use slides for strategy presentations, investor pitches, market research reports, and data-driven business communications.
Usage Points
-
Main Usage
Visualize regional market distribution and industry share through pie chart and geographic map representations, enabling clear communication of market analysis data. Helps investors, executives, and stakeholders quickly understand market size and opportunity areas through strategic visual communication.
-
How to Use
Slide 1: Add orange markers on the US map to indicate key industry hubs and include descriptive text boxes. Slide 2: Display market share using the 60% pie chart and input core statistics in the right information box. Freely edit colors and data values to adapt the template for various industries and regional analyses.
-
Recommended For
Strategy planning teams, sales and marketing departments, investor relations (IR) professionals, consulting firms, and market research organizations. Ideal for new business expansion plans, regional business strategies, investor pitch decks, quarterly business reports, and industry analysis presentations.
-
Slide Structure
2-slide composition: Slide 1 – US map (dark navy background) with 3 orange markers and text description boxes / Slide 2 – 60% pie chart (orange accent) with right-side information box (orange header) and chart legend. 16:9 widescreen format, PPTX file, all elements fully editable.
Related Products
-

Share Chart by Region – Market Analysis Tool
#Market and Competitor Analysis #Graph #Other
-

Donut Chart in Overseas Markets – Market Share Analysis
#Market and Competitor Analysis #Graph #Other
-

Donut Chart Slide Visualizing Target Market Development Status
#Market and Competitor Analysis #Graph #Other
-

Lighting Graph – Market Share and Target Analysis
#Market and Competitor Analysis #Graph #Other
