Donut Chart Slide Visualizing Crime Frequency by Region
RJ0800010_23
- Last Update 08/02/2025
- File Size 2MB
- # of Slides 2
- File Format PPTX
- Slide Ratio 16:9
- Color
Keywords
- #Content-Based Slides
- #Design-Based Slides
- #Market and Competitor Analysis
- #Graph
- #Other
- #Market Share
- #Target Market
- #Circles
- #Doughnut Chart
- #16:9
- #donut chart PowerPoint slide
- #pie chart presentation template
- #regional analysis graph
- #crime statistics visualization
- #percentage data PowerPoint slide
About the Product
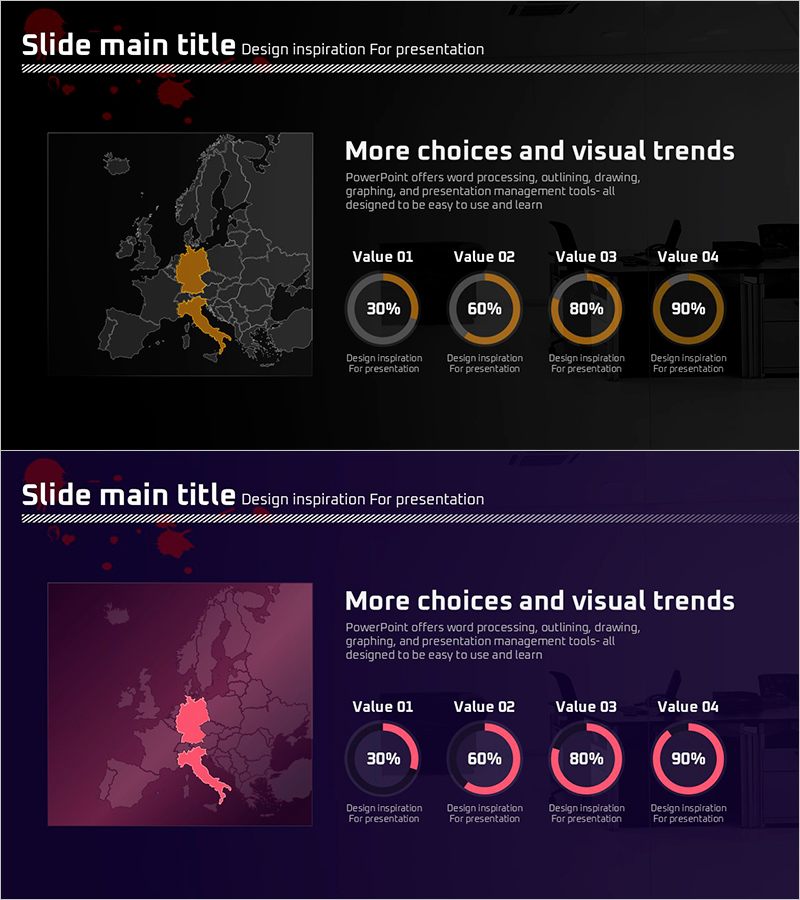
A 4-segment donut chart PowerPoint slide designed to visualize regional crime frequency distribution. The slide features a dark background with orange and gold-toned donut segments that intuitively represent crime rates across different regions. Provided in 2-slide 16:9 widescreen format, it combines a world map background with data visualization for immediate use in regional analysis presentations. Ideal for crime statistics, public safety analysis, regional policy briefings, and data-driven reports. Each segment value is fully editable to accommodate your specific regional data.
Usage Points
-
Main Usage
Effectively display regional crime frequency, public safety statistics, and regional policy analysis using a donut chart format. The 4-segment design allows simultaneous comparison of crime rates across regions, making it ideal for policy makers, law enforcement agencies, and local government presentations.
-
How to Use
Input region names and crime statistics or percentages into each donut segment, and the chart automatically visualizes the data. The world map background emphasizes global scope, while the orange tone conveys caution and alert. Customize region labels, values, and legend text to match your presentation context.
-
Recommended For
Police department crime analysis briefings, local government public safety policy reports, university criminology seminars, media crime statistics coverage, insurance company regional risk assessment, sociology research presentations, and government policy forums.
-
Slide Structure
2-slide set featuring a dark background (black and dark gray) with a 4-segment donut chart (Value 01–04: 30%, 60%, 80%, 90%) overlaid on a world map. Orange and gold donut borders provide visual emphasis. Legend text areas below each segment allow input of region names and descriptive information.
Related Products
-

Analysis of Target Market Construction Status – Data Visualization Tool
#Market and Competitor Analysis #Graph #Other
-

European Target Market Status Graph – Market Share Insights
#Market and Competitor Analysis #Graph #Other
-

Donut Chart Slide Visualizing Target Market Development Status
#Market and Competitor Analysis #Graph #Other
-

Donut Chart in Overseas Markets – Market Share Analysis
#Market and Competitor Analysis #Graph #Other
