Market Entry Potential and Expansion Strategy Chart
RM0500004_10
- Last Update 02/20/2025
- File Size 1.4MB
- # of Slides 2
- File Format PPTX
- Slide Ratio 16:9
- Color
Keywords
- #Content-Based Slides
- #Design-Based Slides
- #Market and Competitor Analysis
- #Graph
- #Market Status
- #Market Analysis
- #Horizontal Bar
- #Circles
- #Segmented Horizontal Bar
- #Pie Chart
- #16:9
- #pie chart PowerPoint slide
- #market analysis presentation
- #bar graph template
- #data visualization slides
- #ratio analysis chart download
About the Product
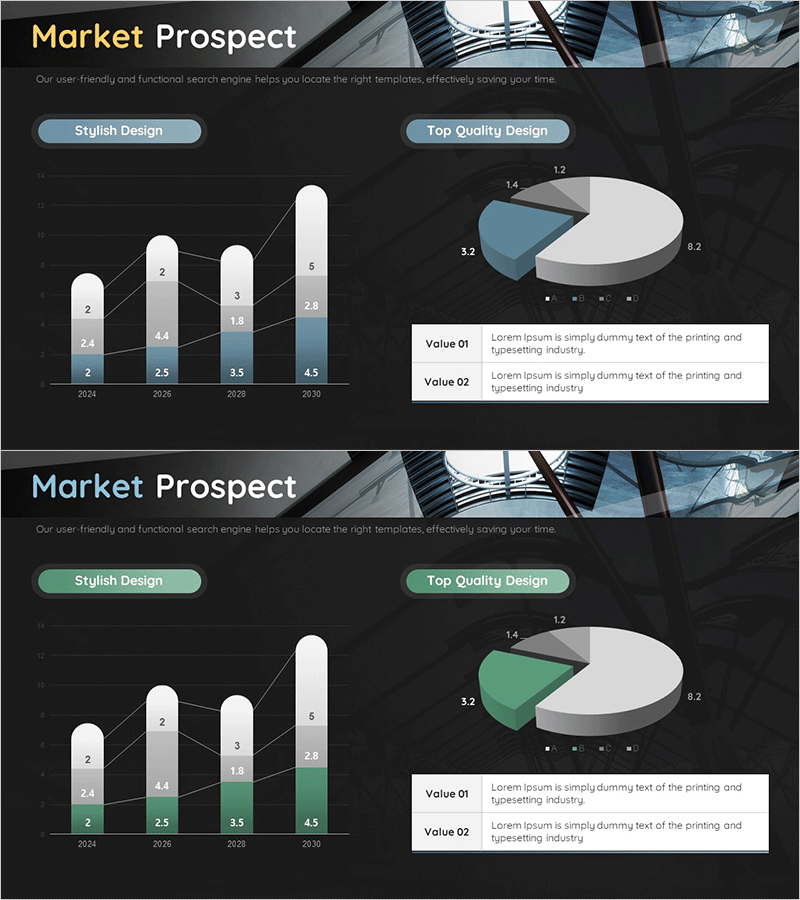
A comprehensive PowerPoint slide deck visualizing market entry potential and expansion strategy through dual-chart design. The first slide features a 4-segment pie chart displaying market composition ratios, while the second presents a multi-series bar graph tracking year-over-year growth trends from 2024 to 2030. Dark background with blue and green accent colors differentiates data hierarchy, and numeric labels with legend enhance information clarity. Two-slide format integrates seamlessly into market analysis sections of business presentations, strategic plans, and analytical reports.
Usage Points
-
Main Usage
Simultaneously express market size and composition ratios via pie chart while displaying year-over-year growth rates and competitive benchmarks through bar graph, strengthening quantitative credibility of market entry strategy. Essential for executive briefings, investor pitches, and strategic business planning requiring evidence-based decision support.
-
How to Use
Input market segmentation data (geographic, customer segment, or product category breakdown) into the first slide's pie chart. Populate the second slide's bar graph with annual market size figures and projected growth rates across 2024–2030. Customize legend labels and numeric values to align with presentation context and audience requirements.
-
Recommended For
Executives, business development teams, and marketing professionals presenting market analysis findings to senior leadership, investors, and strategic partners. Ideal for new market entry evaluations, market expansion strategy presentations, and competitive landscape analysis briefings.
-
Slide Structure
Slide 1: 4-segment donut pie chart with legend and numeric labels / Slide 2: Multi-series vertical bar graph (2024–2030, 4 data series) with trend line overlay and data labels. Dark background with blue, green, and gray tones creating hierarchical information structure.
Related Products
-

Pie Chart & Bar Graph for Market Analysis – Visualizing Data
#Market and Competitor Analysis #Graph #Market Status
-

Trade Market Analysis Graph – Visualizing Market Status
#Market and Competitor Analysis #Graph #Market Status
-

Graph Charts for Systematic Market Analysis – Bar and Pie Charts
#Technical Approach #Market and Competitor Analysis #Diagram
-

Comparative Analysis Graph – Optimal Tool for Market and Competitor Analysis
#Market and Competitor Analysis #Graph #Competitor Analysis
