Global Business Analysis Graph – Market and Competitor Analysis
RJ0300067_20
- Last Update 05/07/2025
- File Size 1MB
- # of Slides 2
- File Format PPTX
- Slide Ratio 16:9
- Color
Keywords
- #Content-Based Slides
- #Design-Based Slides
- #Market and Competitor Analysis
- #Graph
- #Competitor Analysis
- #Market Analysis
- #Horizontal Bar
- #Segmented Horizontal Bar
- #16:9
- #horizontal bar chart PowerPoint
- #market analysis slide template
- #competitor analysis graph
- #business data visualization
- #how to create bar chart in PowerPoint
About the Product
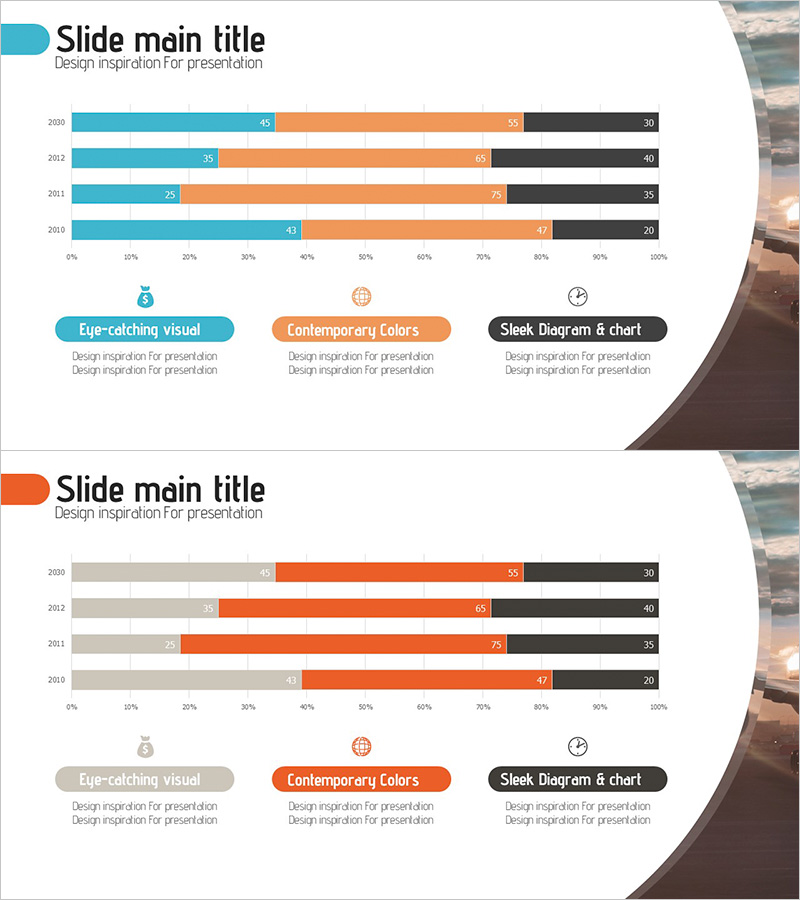
A horizontal bar chart PowerPoint slide designed for global business analysis presentations. This 2-slide template visualizes market and competitor analysis data across 4 data series using blue, orange, and black color coding. The bar chart format enables year-over-year comparison and ranking visualization, making it ideal for business reports and investor presentations. All elements are fully editable in PPTX format for immediate customization.
Usage Points
-
Main Usage
Compares business metrics such as market size, growth rate, and competitor market share across 4 data series using horizontal bars. Simultaneously displays year-over-year trends and item rankings to communicate competitive landscape clearly to executives and investors.
-
How to Use
Insert into business plans, investor pitch decks, and quarterly business reports in the market analysis section. Modify bar lengths and color labels to match your company data. Text labels and values are fully editable for custom data integration.
-
Recommended For
Strategy planning teams, marketing departments, and sales teams presenting market conditions and competitive positioning. Supports data-driven decision-making in executive briefings, investor meetings, and consulting proposals.
-
Slide Structure
2-slide layout with horizontal bar charts displaying 4 data series per slide (e.g., 2020–2023 years or 4 comparison items). Color-coded bars in blue, orange, and black distinguish each series. Horizontal axis shows 0–100% scale; vertical axis lists item names for clear data alignment.
Related Products
-

Chemical Experiment Analysis Horizontal Bar Graph
#Market and Competitor Analysis #Graph #Competitor Analysis
-

Segmented Graph of Learning Goal Achievement – Market and Competitor Analysis
#Market and Competitor Analysis #Graph #Competitor Analysis
-

Detailed Bar Analysis Graph – Market and Competitor Insights
#Market and Competitor Analysis #Graph #Competitor Analysis
-

Market Analysis Bar Graph – Effective Visualization for Competitor Analysis
#Market and Competitor Analysis #Graph #Competitor Analysis
