Segmented Bar Graph for Market Analysis Visualization
RJ0300062_9
- Last Update 05/05/2025
- File Size 0.1MB
- # of Slides 2
- File Format PPTX
- Slide Ratio 16:9
- Color
Keywords
- #Content-Based Slides
- #Design-Based Slides
- #Market and Competitor Analysis
- #Graph
- #Market Analysis
- #Competitive Advantage
- #Horizontal Bar
- #Segmented Horizontal Bar
- #16:9
- #segmented horizontal bar chart PowerPoint
- #market analysis presentation slide
- #bar graph template
- #data comparison chart
- #competitive analysis slide template
About the Product
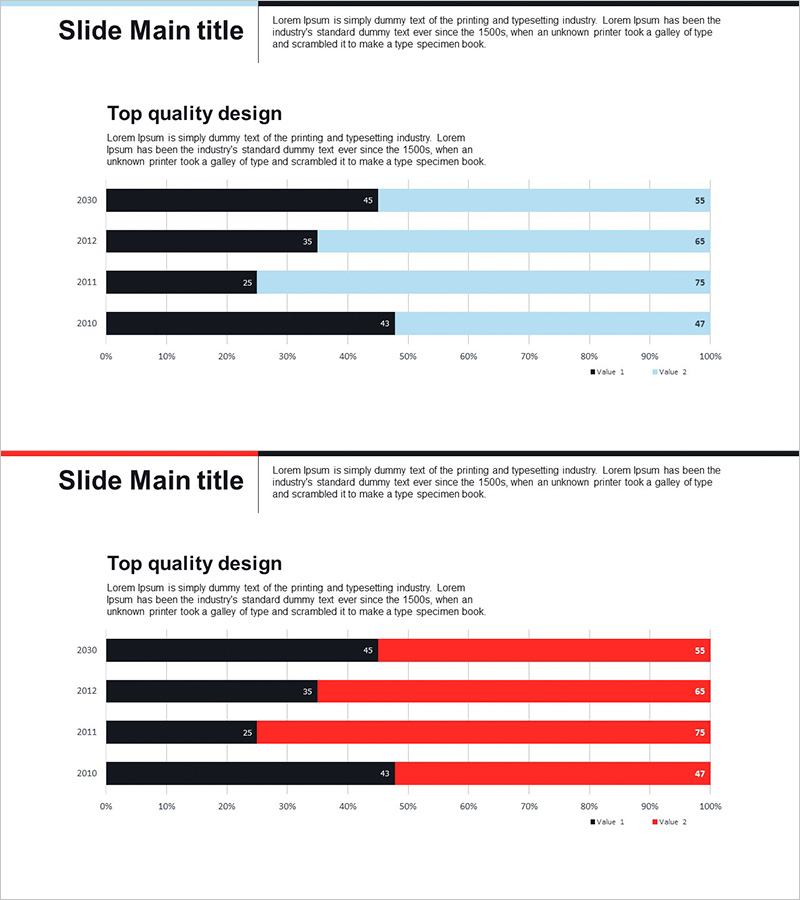
A segmented horizontal bar chart PowerPoint slide optimized for market analysis and competitive positioning. This presentation template displays data across four series—black baseline bars paired with light blue and sky blue data series—to visualize year-over-year trends (2010–2030) and multi-item comparisons simultaneously. The 2-slide deck includes a standard layout on slide 1 and a red-accent variant on slide 2 for flexible presentation contexts. A 0–100% horizontal axis with clear data labels ensures intuitive numerical comparison. Fully editable PPTX format allows instant customization of values and labels to match your dataset.
Usage Points
-
Main Usage
Displays multi-year and multi-item data side-by-side using horizontal bars to communicate market size, market share, and competitor benchmarking. The black baseline and two blue-series data structure supports both numerical comparison and trend analysis in a single visual.
-
How to Use
Insert into business plans, marketing strategy decks, and investor pitch presentations within the market analysis section. Use slide 2's red-accent version to highlight critical data points. Edit the values and labels directly to reflect your own market data, competitive metrics, or sales performance trends.
-
Recommended For
Marketing managers, executives, management consultants, and financial analysts presenting market overview, competitive landscape, and business performance. Ideal when multi-year trends and cross-item comparisons are essential to demonstrate data credibility and market positioning.
-
Slide Structure
2-slide deck. Slide 1: Horizontal bar chart with 3 color series (black, light blue, sky blue) across 4 years (2010–2030), 2 data points per year, 0–100% scale with data labels. Slide 2: Identical structure with red accent series for emphasis. Both slides use 16:9 widescreen layout.
Related Products
-

Segmented Bar Graph for Market Competition Analysis – Data-Driven Insights
#Market and Competitor Analysis #Graph #Market Analysis
-

Horizontal Segmentation Bar Graph for Market Analysis – Competitive Advantage Structure
#Market and Competitor Analysis #Graph #Market Analysis
-

Touch Wide Slide Template – Segmentation Graph Usage
#Market and Competitor Analysis #Graph #Industry Trends
-

3D Segmented Bar Graph for Performance Analysis – Market Trends
#Market and Competitor Analysis #Graph #Customer Analysis
