Sales Status Analysis Graph – Simple and Stylish Design
RJ0300076_5
- Last Update 05/10/2025
- File Size 9.1MB
- # of Slides 2
- File Format PPTX
- Slide Ratio 16:9
- Color
Keywords
- #Content-Based Slides
- #Design-Based Slides
- #Product/Service Introduction
- #Market and Competitor Analysis
- #Graph
- #Development Status
- #Market Share
- #Circles
- #Doughnut Chart
- #16:9
- #donut chart PowerPoint slide
- #pie chart presentation template
- #sales analysis graph
- #circular data visualization
- #market share slide
- #percentage chart download
About the Product
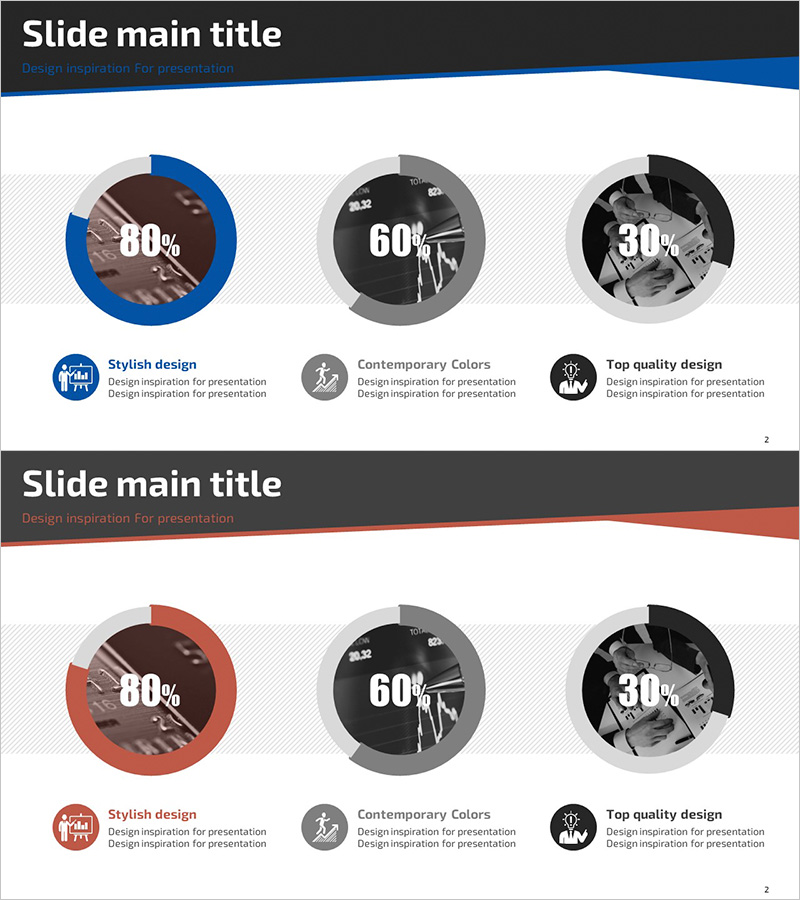
A PowerPoint slide featuring three donut charts for visualizing sales status and market share data. The design combines blue, gray, and black color tones with circular icons and descriptive text labels beneath each chart. This 16:9 widescreen presentation includes 2 slides in fully editable PPTX format. Each donut chart displays percentage data with a hollow center, allowing for additional information or key metrics to be highlighted. Ideal for quarterly business reports, sales presentations, market analysis, and executive dashboards.
Usage Points
-
Main Usage
Effectively visualizes part-to-whole relationships such as sales distribution, market share percentages, and revenue breakdown. The hollow center of each donut allows for emphasis of key metrics or totals, while multiple charts enable side-by-side data comparison.
-
How to Use
Customize each donut chart's segments and colors to match your actual data values. Replace the circular icons with relevant category symbols and update the text labels with your specific data points. Present each chart sequentially to guide the audience through your analysis and highlight key insights.
-
Recommended For
Finance teams presenting quarterly earnings reports, marketing departments analyzing customer segmentation, sales teams showcasing regional performance, and executives reviewing business metrics. Best suited for situations requiring clear, quantitative data representation.
-
Slide Structure
2-slide deck with 3 donut charts arranged horizontally on each slide. Each chart features a gray border, percentage values in the center, and a circular icon with title and description text positioned below in a 3-row layout.
Related Products
-

Financial Business Analysis Pie Chart – Market Share Insights
#Product/Service Introduction #Market and Competitor Analysis #Graph
-

Graph of Analysis of Transportation Development Status
#Product/Service Introduction #Market and Competitor Analysis #Graph
-

Analysis graph of market share progress
#Product/Service Introduction #Market and Competitor Analysis #Graph
-

Mobile App Market Share Analysis Graph
#Product/Service Introduction #Market and Competitor Analysis #Diagram
