Analysis graph of market share progress
RJ0300092_24
- Last Update 05/15/2025
- File Size 1MB
- # of Slides 2
- File Format PPTX
- Slide Ratio 16:9
- Color
Keywords
- #Content-Based Slides
- #Design-Based Slides
- #Product/Service Introduction
- #Market and Competitor Analysis
- #Graph
- #Development Status
- #Market Share
- #Circles
- #Doughnut Chart
- #16:9
- #doughnut chart PowerPoint
- #pie chart template
- #ratio analysis slide
- #market share visualization
- #data visualization PowerPoint
- #percentage chart slide
About the Product
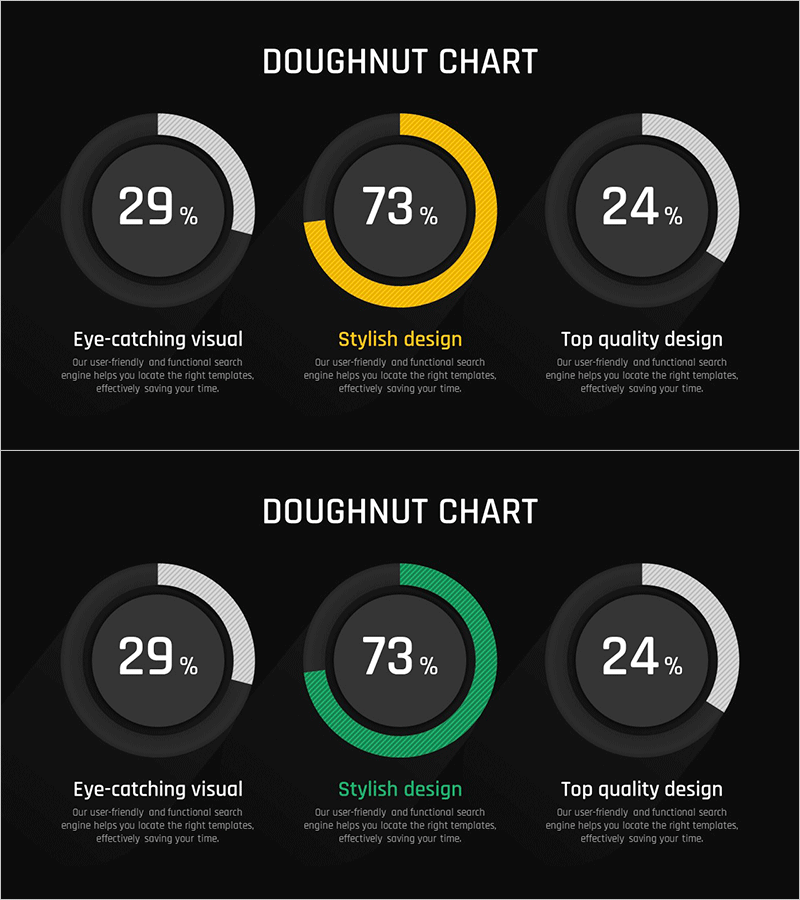
A doughnut chart PowerPoint slide template designed to visualize ratio data such as market share, sales performance, and achievement metrics. Set against a dark background with white, yellow, and green accent colors, this slide clearly displays percentage values for three items. Each chart features the key percentage in the center with descriptive labels below, making it ready for immediate use in presentations, reports, and analytical materials. The 2-slide set offers multiple color combinations, with fully editable numbers and labels for customization.
Usage Points
-
Main Usage
Clearly expresses the proportional relationship between parts and whole, such as market share, sales ratio, performance achievement, and customer satisfaction. Enables simultaneous comparison of three items' percentages, making it effective for business performance analysis, marketing results reporting, and financial situation explanations.
-
How to Use
Use in executive reports, quarterly performance presentations, market analysis materials, and investor briefings to emphasize key metrics. Replace percentage values and labels with actual data, and adjust colors as needed to match your corporate brand identity and presentation style.
-
Recommended For
Recommended for executives, marketing managers, financial analysts, sales directors, and consultants who need to explain data-driven decisions. Ideal for quarterly earnings reports, market situation analysis, competitive benchmarking, and situations requiring visual communication of quantitative results.
-
Slide Structure
Two-slide set with three doughnut charts arranged horizontally on each slide. First slide features white, yellow, and gray accents; second slide uses white, green, and gray accents for color variety. Each chart displays percentage values in the center with item names and descriptive text positioned below.
Related Products
-

Doughnut Chart Visualizing Current Status of 3D Printing Technology Development
#Product/Service Introduction #Market and Competitor Analysis #Graph
-

City Theme Market Share Graph – Business Data Visualization
#Product/Service Introduction #Market and Competitor Analysis #Graph
-

Analysis of Work Progress – Utilizing Pie Chart
#Product/Service Introduction #Market and Competitor Analysis #Graph
-

Sales Status Analysis Graph – Simple and Stylish Design
#Product/Service Introduction #Market and Competitor Analysis #Graph
