Black Navy Broken Line Graph Table – Market and Competitor Analysis
RJ0700010_9
- Last Update 07/24/2025
- File Size 1.1MB
- # of Slides 2
- File Format PPTX
- Slide Ratio 16:9
- Color
Keywords
- #Content-Based Slides
- #Design-Based Slides
- #Market and Competitor Analysis
- #Diagram
- #Graph
- #Competitor Analysis
- #Market Analysis
- #Table
- #Line
- #Standard Table
- #Line Chart
- #16:9
- #line chart PowerPoint
- #trend analysis slide template
- #market analysis graph
- #competitor comparison chart
- #data visualization PowerPoint slide
About the Product
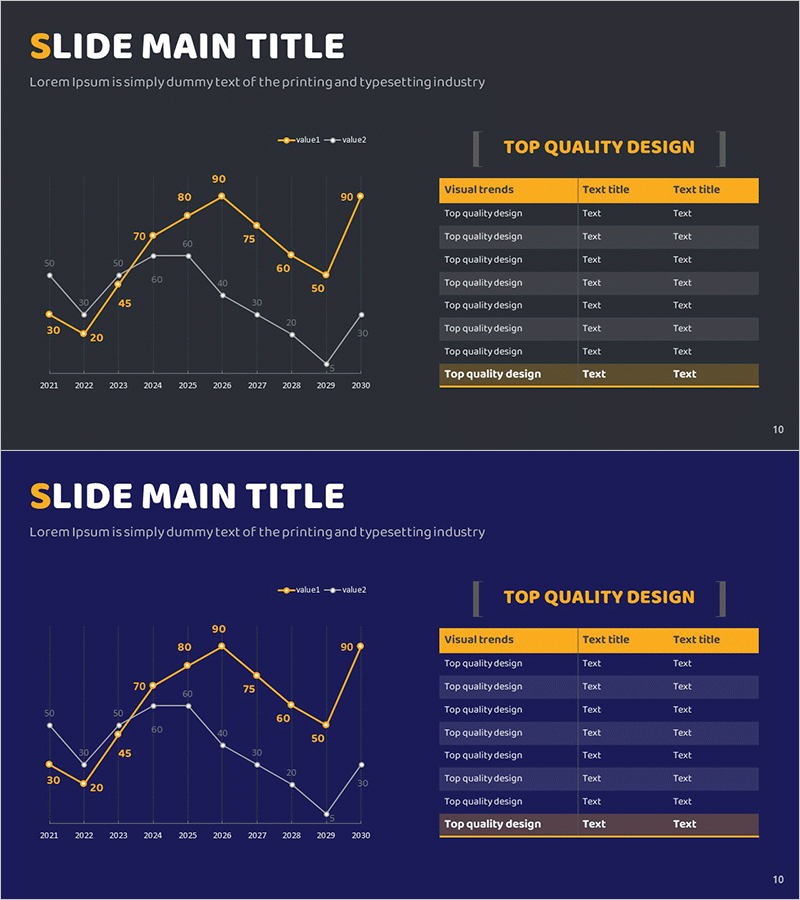
A professional line chart PowerPoint slide optimized for market analysis and competitive comparison. The dual-series line graph on a black and navy background with gold accents clearly visualizes numerical changes and trends over time. The accompanying data table provides precise figures that complement the chart, enabling credible information delivery in presentations and reports. With 2-slide composition, this template is ready for immediate use in various presentation scenarios.
Usage Points
-
Main Usage
Compares numerical changes and trends over time using two data series. Effectively visualizes market size evolution, sales trends, customer satisfaction changes, and other time-series data. Ideal for competitive performance analysis and year-over-year comparisons.
-
How to Use
Slide 1 presents the trend visually through the line chart, while Slide 2 displays precise figures in a data table. During presentation, emphasize rising and falling points on the graph, then reinforce credibility with the table. All colors and values are fully editable.
-
Recommended For
Recommended for business reports, market analysis presentations, executive briefings, investor pitch decks, and quarterly or annual performance reviews. Suitable for marketing teams, sales departments, executives, consultants, and data analysts.
-
Slide Structure
Slide 1: Dual-series line chart (2021–2030, 10 data points, gold accents), legend, title area. Slide 2: Data table (Visual trends header, 8 rows × 3 columns, gold highlight row). Full 16:9 aspect ratio, PPTX format.
Related Products
-

Competitor Market Analysis Table – Strategic Insights
#Market and Competitor Analysis #Diagram #Graph
-

Graph Chart for Analysis Comparison – Market and Competitor Analysis
#Market and Competitor Analysis #Diagram #Graph
-

Market Comparison Analysis Broken Line Graph – Competitor Analysis and Visual Impact
#Market and Competitor Analysis #Diagram #Graph
-

Sales and Profit Analysis Graph – Market Trends and Forecast
#Market and Competitor Analysis #Diagram #Graph
