Project Market Environment Analysis Chart – Powerful Competitive Strategy
RM0200005_13
- Last Update 02/02/2025
- File Size 1MB
- # of Slides 2
- File Format PPTX
- Slide Ratio 16:9
- Color
Keywords
- #Content-Based Slides
- #Design-Based Slides
- #Market and Competitor Analysis
- #Graph
- #Competitor Analysis
- #Market Analysis
- #Column
- #Line
- #Grouped Column
- #Line Chart
- #16:9
- #line chart PowerPoint slide
- #market analysis presentation template
- #trend graph download
- #competitive analysis chart
- #data visualization PPT
About the Product
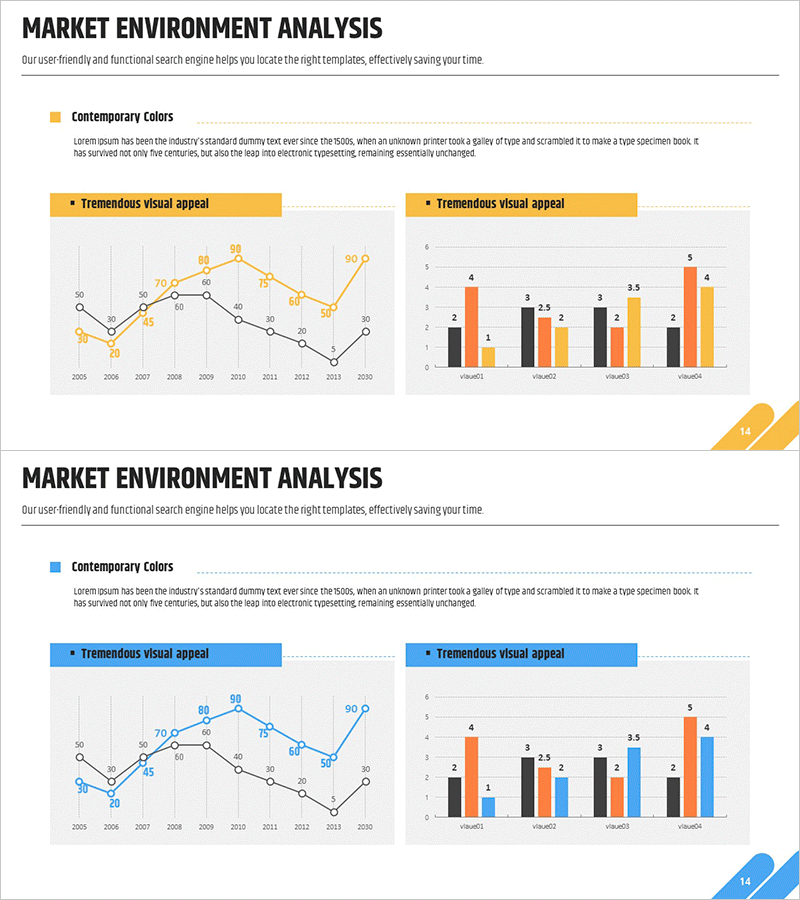
A 2-slide PowerPoint presentation set featuring line and bar charts for market environment analysis and competitive strategy. The first slide displays a multi-series line chart tracking market trends from 2005 to 2020, while the second slide presents a vertical bar chart comparing four key metrics across competitors. Orange and black color contrast clearly distinguishes data series, with grid background for easy value reading. Ready-to-use presentation slides for market trend analysis, competitive performance benchmarking, and business results reporting.
Usage Points
-
Main Usage
Visualize long-term market trends and competitive performance comparison through data-driven charts. The line chart represents 15 years of market evolution from 2005 to 2020, while the bar chart enables side-by-side comparison of four key metrics. Ideal for executive reports, investor presentations, and business strategy pitches to demonstrate market position and competitive advantage with objective data.
-
How to Use
First slide uses multi-series line chart to show overall market trajectory alongside company performance. Second slide employs vertical bar chart to highlight competitive positioning at a specific timepoint. Edit chart values and legends to input actual data, and adjust colors to match corporate branding. All elements are fully editable in PowerPoint format.
-
Recommended For
Quarterly and annual business reports for executives, investor relations materials, market analysis sections in business proposals, and competitive landscape analysis in marketing strategy presentations. Suitable for consulting firms, financial institutions, and manufacturing or IT companies presenting strategic initiatives.
-
Slide Structure
Slide 1: Multi-series line chart (2 series in orange and black) tracking 15-year trend from 2005–2020, grid background, legend included. Slide 2: Vertical bar chart comparing 4 values with 3-color series (black, orange, yellow), value labels displayed. 16:9 widescreen format, PPTX file with fully editable elements.
Related Products
-

Competitor Capability Analysis Chart – Efficient Market Analysis
#Market and Competitor Analysis #Graph #Competitor Analysis
-

Line Graph and Clustered Column Graph – Essential for Competitor Analysis
#Market and Competitor Analysis #Graph #Competitor Analysis
-

Financial Services Market Analysis Graph – Competitor Analysis and Sustainability
#Market and Competitor Analysis #Graph #Competitor Analysis
-

PC Mockup & Column Bundle Graph
#Market and Competitor Analysis #Graph #Other
