Data Analysis Graph Visualization for Market Competition
RJ0700017_27
- Last Update 07/26/2025
- File Size 0.5MB
- # of Slides 2
- File Format PPTX
- Slide Ratio 16:9
- Color
Keywords
- #Content-Based Slides
- #Design-Based Slides
- #Market and Competitor Analysis
- #Diagram
- #Graph
- #Competitor Analysis
- #Market Analysis
- #Cluster
- #Line
- #Chain Diagram
- #Line Chart
- #16:9
- #line chart PowerPoint
- #multi-series chart template
- #trend analysis slide
- #data visualization presentation
- #business chart PowerPoint
- #graph slide design
About the Product
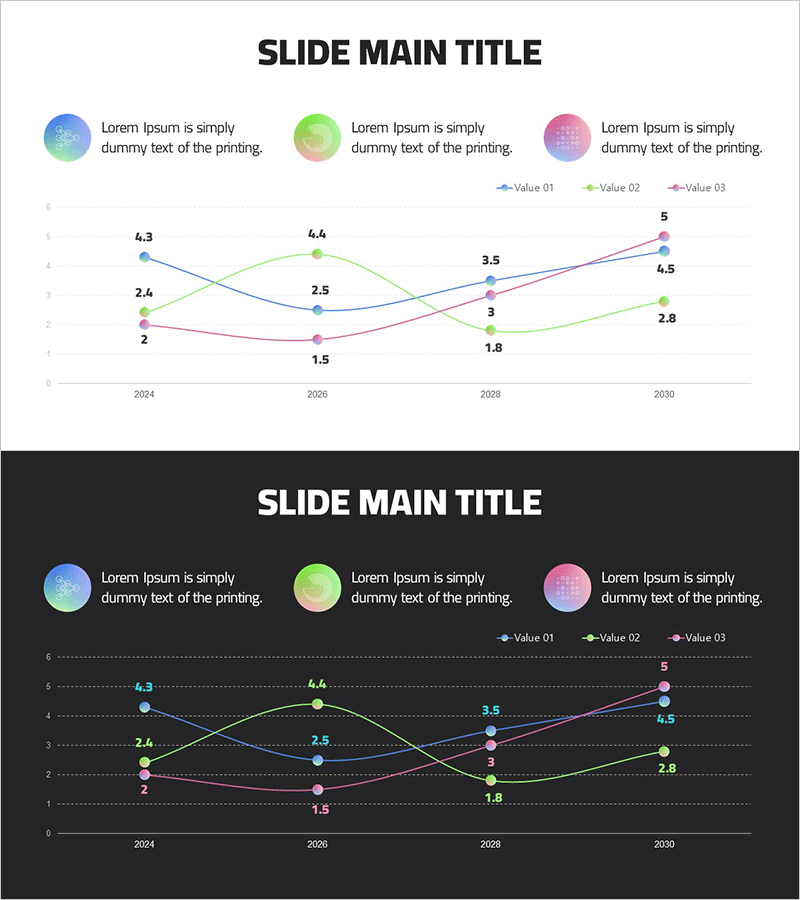
A professional line chart PowerPoint slide designed for market competition analysis and multi-series data comparison. This presentation template displays three independent data series across four time points (2024, 2026, 2028, 2030), each distinguished by blue, green, and pink gradient circular icons. Two versions are included—a light background slide and a dark background slide—allowing you to select the best fit for your presentation environment. Data point values are clearly labeled at each intersection, making it easy to identify competitive dynamics and performance reversals. The crossing lines provide intuitive visual insight into market shifts and relative performance trends. Ideal for business presentations including sales forecasts, market share analysis, customer satisfaction metrics, and competitive benchmarking.
Usage Points
-
Main Usage
Visualize and compare multiple data series over time—such as market competition analysis, sales trends, performance metrics, and customer satisfaction changes. The intersecting lines clearly show competitive positioning, market shifts, and relative performance advantages or disadvantages at each time point.
-
How to Use
Open the slide and replace the existing numerical values with your own data. Update the legend labels (Value 01, 02, 03) to match your actual categories, then modify the data point numbers. The chart will automatically reflect your changes. Use the light background version for bright meeting rooms and online presentations; use the dark background for auditoriums and projector environments.
-
Recommended For
Executive reports, quarterly and annual performance reviews, marketing strategy meetings, investor presentations, consulting proposals, and market research reports. Ideal for executives, business analysts, planners, marketers, sales leaders, and data professionals who need to communicate data-driven insights.
-
Slide Structure
Each slide features a legend at the top with three series (blue, green, pink circular icons with labels), and a central line chart with X-axis showing years (2024, 2026, 2028, 2030) and Y-axis showing values (0–6). Three lines intersect across the chart, with precise numerical labels (ranging 2.0–5.0) at each data point.
Related Products
-

Competitor Analysis Broken Line Graph – Market Insights Provided
#Market and Competitor Analysis #Graph #Competitor Analysis
-

Medical Development Data Analysis Graph – Market and Competitor Analysis
#Market and Competitor Analysis #Graph #Competitor Analysis
-

Line Graph Analysis Slide – Analyze the Market with Blue and Navy
#Market and Competitor Analysis #Graph #Competitor Analysis
-

Market Analysis Graph & Notebook Mockup – Understanding the Market through Data Visualization
#Market and Competitor Analysis #Graph #Other
