Competitor Technology Comparison Graph – Market and Competitor Analysis
RM0200013_17
- Last Update 02/05/2025
- File Size 0.3MB
- # of Slides 2
- File Format PPTX
- Slide Ratio 16:9
- Color
Keywords
- #Content-Based Slides
- #Design-Based Slides
- #Market and Competitor Analysis
- #Graph
- #Competitor Analysis
- #Market Analysis
- #Line
- #Line Chart
- #16:9
- #line chart PowerPoint slide
- #trend comparison presentation
- #competitor analysis graph
- #market analysis PPT
- #data visualization slide
- #how to create line chart in PowerPoint
About the Product
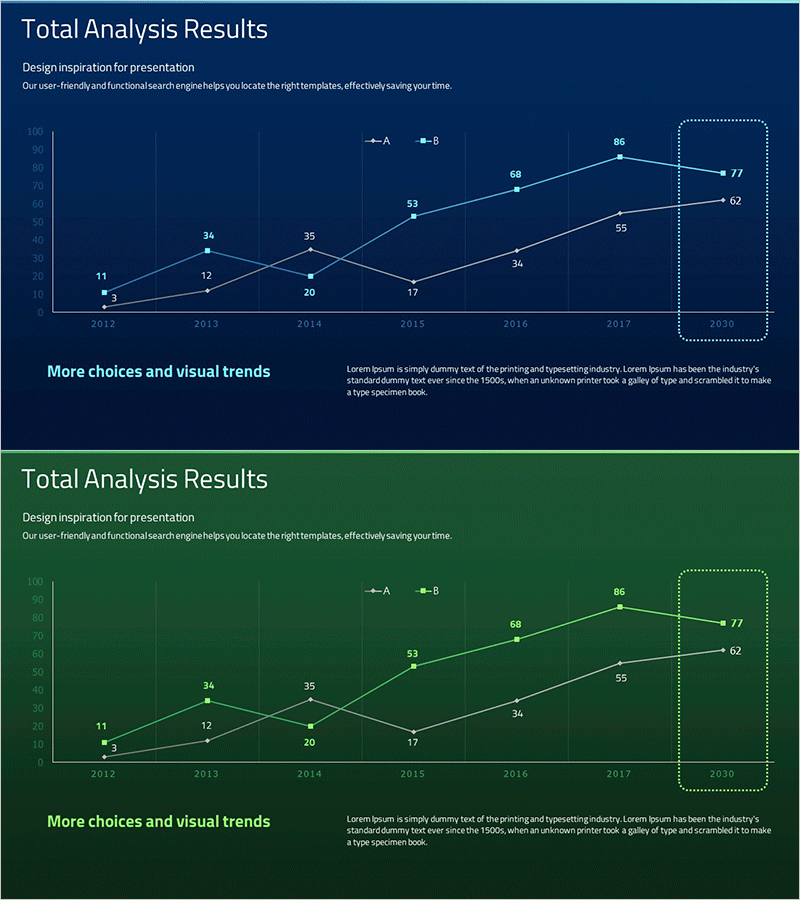
A line chart PowerPoint slide designed for competitor technology comparison and market analysis presentations. This template visualizes data trends from 2012 to 2020 using two distinct series, enabling clear comparison of competitive performance trajectories. The dark blue background with bright trend lines creates a professional presentation atmosphere, while data point labels ensure accurate information delivery. The 16:9 widescreen format with 2-slide composition allows immediate editing and deployment in your business presentations.
Usage Points
-
Main Usage
Optimized for comparing competitor technology performance and market share evolution over time. Two trend lines simultaneously display your company and competitors' growth trajectories, enabling stakeholders to instantly grasp relative positioning and trend shifts.
-
How to Use
Deploy in investor briefings, executive reports, and strategic planning meetings to explain competitive landscape. Edit the data points and values with your actual company metrics to create a credible analytical document ready for immediate presentation use.
-
Recommended For
Ideal for marketing managers, strategy planning teams, executives, and investor relations professionals. Particularly effective for quarterly and annual performance comparisons, competitive strength analysis, and technology roadmap progress reporting.
-
Slide Structure
Two-slide composition featuring a dark blue background line chart (dual series, 8 data points from 2012–2020) on the first slide, with analysis interpretation text area on the second. Includes legend, axis labels, and gridlines for enhanced data readability.
Related Products
-

Project Market Environment Analysis Chart – Powerful Competitive Strategy
#Market and Competitor Analysis #Graph #Competitor Analysis
-

Virus Analysis Broken Line Graph – Market and Competitor Analysis
#Market and Competitor Analysis #Graph #Competitor Analysis
-

Competitor Analysis Graph for Market Capture
#Market and Competitor Analysis #Graph #Competitor Analysis
-

Competitor Analysis Broken Line Graph – Market Insights Provided
#Market and Competitor Analysis #Graph #Competitor Analysis
