Business Market Analysis Segmented Vertical Bar Graph
RM0200011_17
- Last Update 02/04/2025
- File Size 1.2MB
- # of Slides 2
- File Format PPTX
- Slide Ratio 16:9
- Color
Keywords
- #Content-Based Slides
- #Design-Based Slides
- #Business Introduction
- #Market and Competitor Analysis
- #Graph
- #Technological Status
- #Market Analysis
- #Column
- #Segmented Column
- #16:9
- #segmented vertical bar chart
- #vertical bar graph PowerPoint
- #market analysis presentation
- #competitive analysis slide
- #bar chart PPT template
About the Product
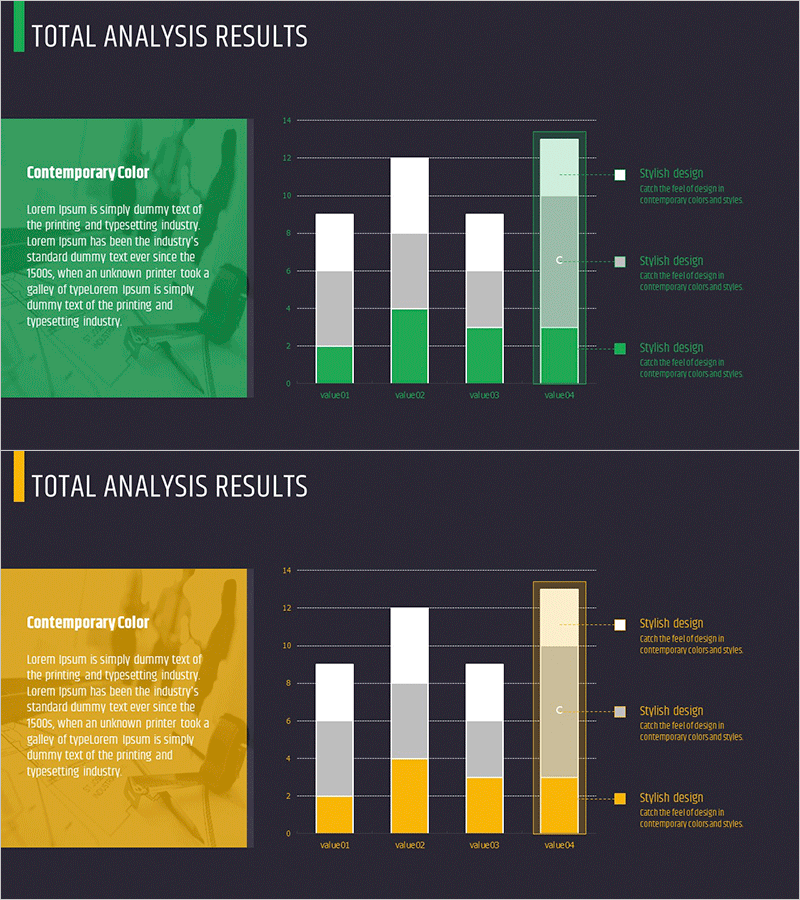
A segmented vertical bar chart PowerPoint slide optimized for business market analysis and competitive benchmarking. This presentation template visualizes four data series simultaneously, enabling clear representation of market segmentation, category-wise performance, and competitive positioning. The dark background with white, green, and light green bar colors enhances presentation professionalism. The 2-slide set supports diverse data combinations and is ready for immediate editing and deployment in business reports and strategy presentations.
Usage Points
-
Main Usage
Simultaneously express market segmentation, category-wise data comparison, and competitive positioning using four bar series to support data-driven decision-making in business analysis reports, strategy presentations, and sales pitches.
-
How to Use
Adjust bar heights to match your data, replace legend text with category names, and edit title and axis labels to fit your presentation context. Color scheme is maintained but individual bar colors can be customized as needed.
-
Recommended For
Market analysis presentations for marketing, sales, and executive audiences; business reports and strategic planning documents; competitive benchmarking analysis; quarterly or annual performance comparison presentations.
-
Slide Structure
2-slide set. Each slide features four vertical bar groups in four series (white, green, light green, pale green) with legend and descriptive text area positioned on the right side for clear data interpretation.
Related Products
-

Tablet PC Mockup Vertical Bar Graph – Market Analysis and Tech Insights
#Business Introduction #Market and Competitor Analysis #Graph
-

Graph of Changes After a Healthy Diet – Data Visualization Template
#Market and Competitor Analysis #Graph #Market Analysis
-

Stereographic Segmentation Bar Chart – Visualization of Market Analysis and Trends
#Market and Competitor Analysis #Graph #Market Analysis
-

Vertical Bar Chart for Learning Outcomes Comparison - Market Share Visualization
#Market and Competitor Analysis #Graph #Market Analysis
