Four Color Infographic Vertical Bar Segmentation Graph – Business Strategy
RJ0200037_23
- Last Update 04/08/2025
- File Size 0.9MB
- # of Slides 2
- File Format PPTX
- Slide Ratio 16:9
- Color
Keywords
- #Content-Based Slides
- #Design-Based Slides
- #Business Strategy
- #Market and Competitor Analysis
- #Graph
- #Market Analysis
- #Column
- #Segmented Column
- #Project Progress
- #16:9
- #stacked bar chart PowerPoint
- #vertical bar graph template
- #business progress slide
- #data visualization PPT
- #how to create stacked bar chart in PowerPoint
About the Product
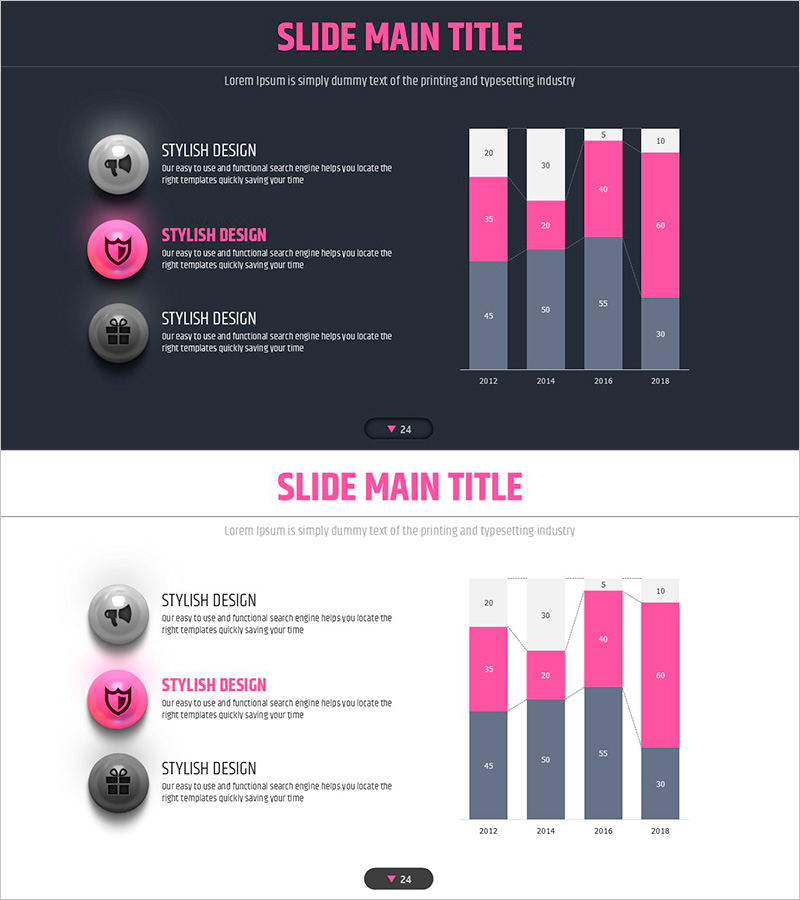
A vertical stacked bar chart PowerPoint slide designed to visualize business progress and performance metrics over time. This data visualization template features four color segments (pink, gray, white, and accent) representing different data categories across four years (2012, 2014, 2016, 2018). The stacked bar format allows simultaneous comparison of total volume and individual component contributions. Fully editable PPTX format enables quick customization for business performance reports, marketing analytics, strategic planning presentations, and quarterly/annual reviews.
Usage Points
-
Main Usage
Visualize complex business metrics by displaying both total values and component breakdowns across multiple time periods. Ideal for presenting year-over-year progress, departmental contributions, revenue streams, or market segment performance in executive presentations and strategic planning sessions.
-
How to Use
Input your data values into each color segment corresponding to the categories and years shown. The chart automatically updates as you modify the numbers. Customize colors, labels, and titles to match your brand or specific reporting requirements. Compatible with PowerPoint 2016 and later versions.
-
Recommended For
Executive presentations on business performance, marketing team quarterly/annual reports, investor pitch decks, strategic planning meetings, departmental performance reviews, and financial analysis presentations where multi-category comparison is essential.
-
Slide Structure
Two-slide template. First slide features dark background with 4-color stacked vertical bars (4 years × 3-4 data categories per year). Second slide presents the same chart structure on light background. Left side includes three circular icons with descriptive text labels for context and interpretation.
Related Products
-

Business Forest Wide Template Vertical Bar Chart – Visualizing Business Strategy
#Business Strategy #Graph #Column
-

Segmented Analysis of Interior Trends – Data Visualization for Market Analysis
#Market and Competitor Analysis #Financial Plans and Performance #Graph
-

3D Segmented Bar Graph for Performance Analysis – Market Trends
#Market and Competitor Analysis #Graph #Customer Analysis
-

Subdivided Graphs and Tables Slide – Market Analysis and Performance Data
#Market and Competitor Analysis #Financial Plans and Performance #Diagram
