Vertical Bar Market Analysis Segmentation Graph - Data Visualization
RJ0300077_13
- Last Update 05/10/2025
- File Size 1.1MB
- # of Slides 2
- File Format PPTX
- Slide Ratio 16:9
- Color
Keywords
About the Product
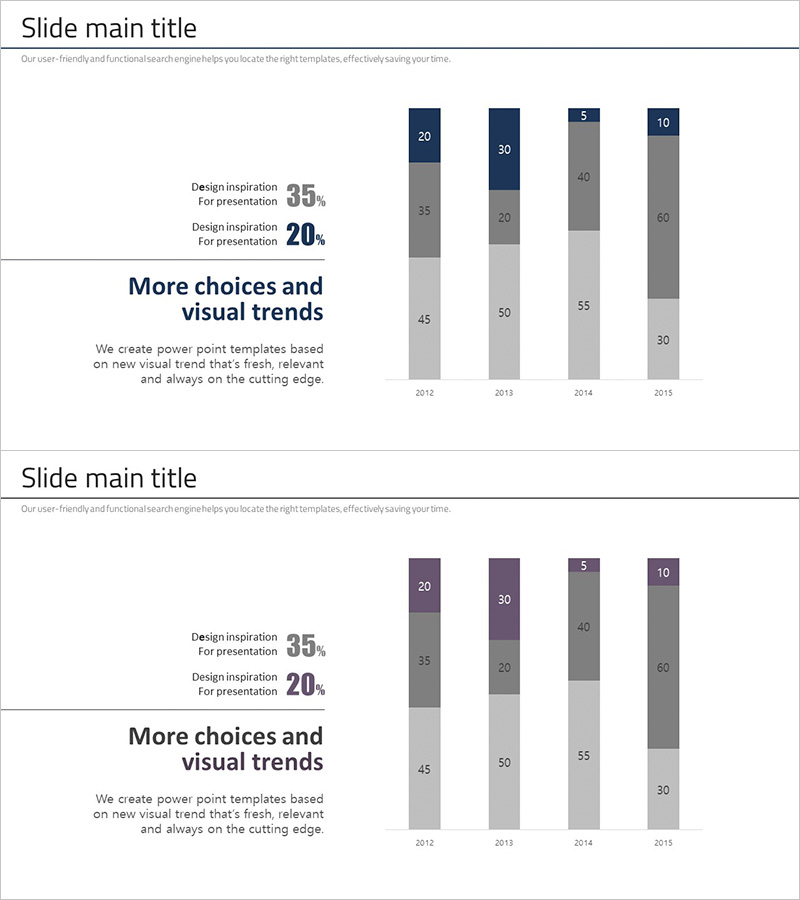
A vertical bar chart PowerPoint slide that visualizes market size and share across four data series from 2012 to 2015. Each year is represented with segmented bars in navy, gray, and dark gray tones, enabling clear comparison of market trends and composition changes. This presentation slide is ready to use for competitive analysis, market share comparison, revenue breakdown analysis, and other business presentations.
Usage Points
-
Main Usage
Compares multiple data points such as market size, share, and revenue composition across years. Segmented bars simultaneously display total volume and individual item proportions, making it ideal for complex data visualization.
-
How to Use
Insert into the market analysis section of executive reports, business plans, or marketing proposals to explain competitive landscape and market shifts. Directly edit numbers to match your company data for immediate use.
-
Recommended For
Marketing managers, business planning teams, sales directors, and consultants who require data-driven decision-making. Highly effective for quarterly or annual performance reviews and market research presentations.
-
Slide Structure
Two-slide set featuring vertical bar charts with 4 data series across 4 years. First slide uses navy tones, second uses purple tones. Each bar is divided into 4 segments with numerical labels at the top for precise data communication.
Related Products
-

Business Goal Setting & Analysis Graph – For Competitive Analysis
#Market and Competitor Analysis #Marketing Plan and Strategy #Graph
-

Analysis Vertical Bar Graph – Market Competitiveness Visualization
#Market and Competitor Analysis #Graph #Competitor Analysis
-

Vertical Bar Graph for Sector Analysis – Optimizing Data Visualization
#Market and Competitor Analysis #Graph #Competitor Analysis
-

Monthly Analysis Graph of Banking Services Sector – Market and Competitor Analysis
#Market and Competitor Analysis #Financial Plans and Performance #Graph
