Competitor Comparison Analysis Graph
RJ0400050_28
- Last Update 05/31/2025
- File Size 0.1MB
- # of Slides 2
- File Format PPTX
- Slide Ratio 16:9
- Color
Keywords
- #Content-Based Slides
- #Design-Based Slides
- #Market and Competitor Analysis
- #Graph
- #Competitor Analysis
- #Competitive Advantage
- #Horizontal Bar
- #Double Horizontal Bar
- #16:9
- #competitor comparison chart
- #horizontal bar graph PowerPoint
- #comparison analysis presentation
- #5-category chart slide
- #competitive analysis template
- #dual-series bar chart
About the Product
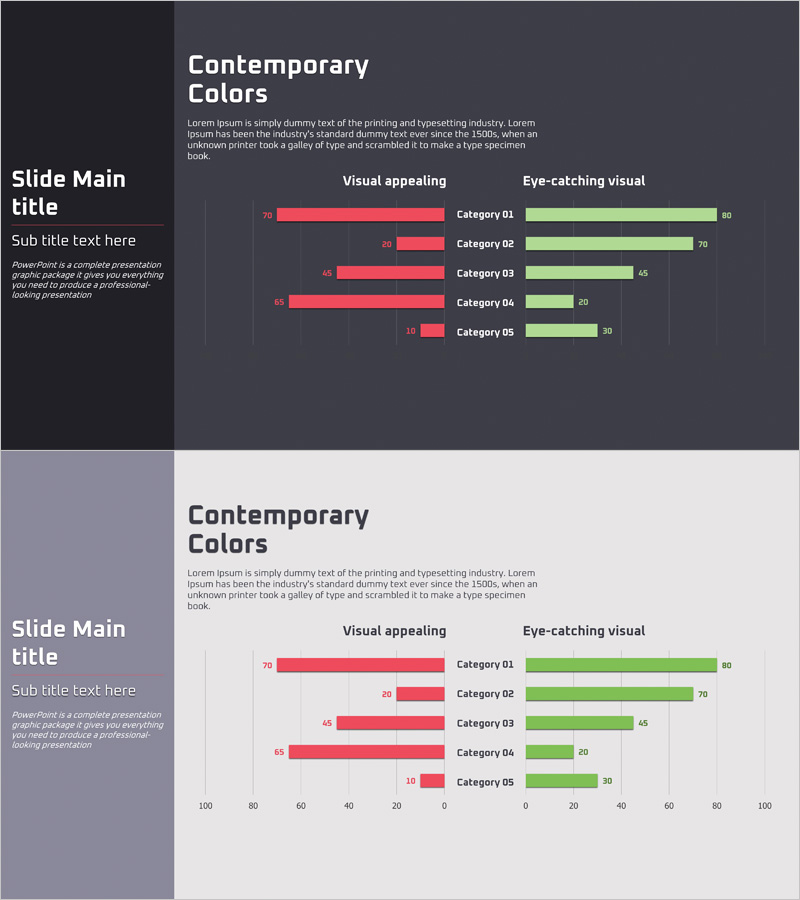
A horizontal bar chart PowerPoint slide optimized for competitive analysis and market comparison presentations. Designed with a dark gray background featuring coral red and lime green dual-series bars to compare five categories simultaneously. Each item displays numerical values clearly, making it immediately applicable for competitive advantage analysis, performance benchmarking, and industry comparison presentations. The 2-slide set provides both dark and light theme background options, allowing customization to match your corporate brand colors.
Usage Points
-
Main Usage
Visualizes competitive performance comparison, market share analysis, and industry benchmarking data. The dual-series bars simultaneously represent your company and competitors' metrics, clearly communicating relative market positioning.
-
How to Use
Insert into executive reports, investor pitch decks, and strategic planning meetings during competitive landscape analysis sections. Replace bar values with actual data and update category labels for immediate use. Colors are fully customizable to match corporate branding.
-
Recommended For
Recommended for marketing managers, strategic planning teams, executives, and investor relations presentations. Particularly effective for competitive analysis, market research findings, and quarterly performance comparison reports.
-
Slide Structure
2-slide set. Each slide displays 5 categories (Category 01–05) on the horizontal axis with coral red (left bar) and lime green (right bar) dual series representing numerical values. Value labels appear at the end of each bar for precise data comparison.
Related Products
-

Sailing Travel Service Company and Competitor Analysis Dual Horizontal Chart
#Market and Competitor Analysis #Graph #Competitor Analysis
-

Business Analysis Bilinear Bar Graph
#Market and Competitor Analysis #Graph #Competitor Analysis
-

Horizontal Bar Graph for Cooking Competition
#Market and Competitor Analysis #Graph #Competitor Analysis
-

Bar Graph for Competitor Analysis – Business Advantage
#Market and Competitor Analysis #Graph #Competitor Analysis
