Competitor Analysis Double Bar Graph – Visualizing Competitive Advantage
RJ0300053_18
- Last Update 05/02/2025
- File Size 1.3MB
- # of Slides 2
- File Format PPTX
- Slide Ratio 16:9
- Color
Keywords
- #Content-Based Slides
- #Design-Based Slides
- #Market and Competitor Analysis
- #Graph
- #Competitor Analysis
- #Competitive Advantage
- #Horizontal Bar
- #Double Horizontal Bar
- #16:9
- #double bar chart PowerPoint
- #competitor analysis presentation
- #horizontal bar comparison slide
- #data visualization PPT
- #competitive advantage template
About the Product
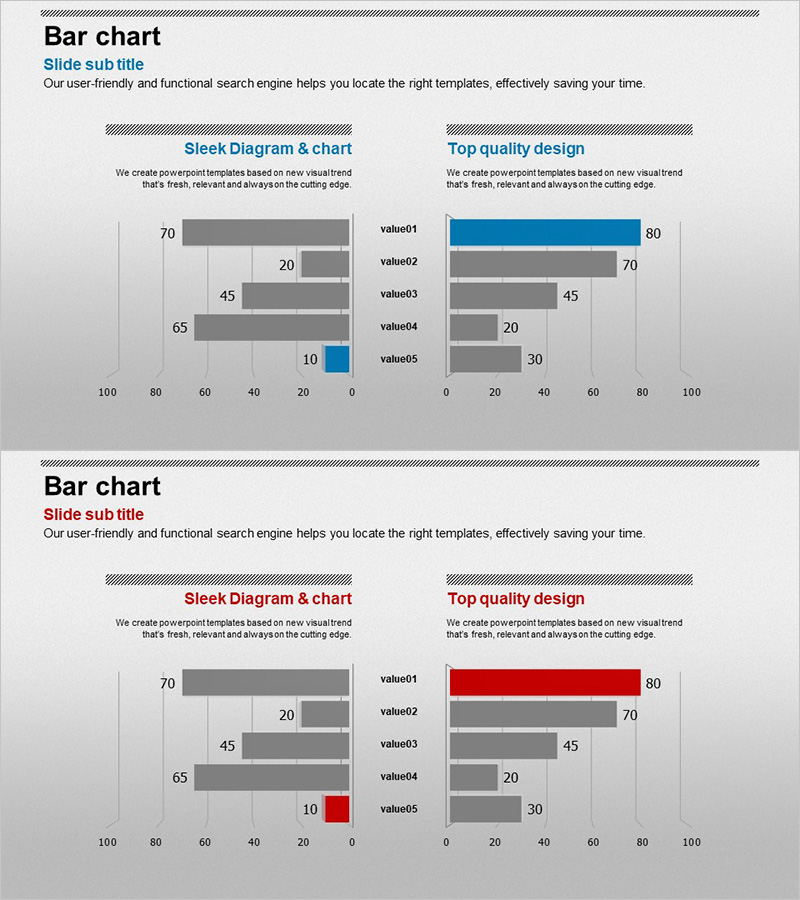
A horizontal bar chart PowerPoint template optimized for competitive analysis and market comparison. This slide deck features two data series displayed side-by-side with contrasting colors—gray tones on the left and accent colors (blue or red) on the right—enabling instant visual comparison. Five items (value01 through value05) with numeric values ranging from 0 to 100 are automatically reflected when entered, with clear numeric labels displayed for each item. Ideal for competitive advantage analysis, market share comparison, product performance benchmarking, and other comparative presentations requiring immediate deployment.
Usage Points
-
Main Usage
Visualizes two data series in side-by-side contrast format to compare competitor performance, market share, satisfaction ratings, and other metrics intuitively. Clear numeric labels for each item ensure accurate data communication and professional presentation impact.
-
How to Use
Enter left-side (gray tone) and right-side (accent color) numeric values for each of the five items, and bar lengths automatically adjust proportionally. Modify item names and values to adapt for competitive analysis, market research, performance benchmarking, and various comparative presentations.
-
Recommended For
Marketing and strategy professionals presenting competitor analysis to executives, sales teams demonstrating product superiority to clients, consultants presenting market analysis findings, and anyone requiring quantitative comparisons in presentations. Suitable for all situations demanding side-by-side data visualization.
-
Slide Structure
Two-slide layout: first slide displays gray-tone double bars (left values: 70, 45, 65, 20, 10), second slide shows blue and red accent double bars (right values: 80, 70, 45, 20, 30) with identical five items in contrasting format. Provided in 16:9 widescreen aspect ratio.
Related Products
-

Competitor Analysis and Competitive Advantage Visualization – Harmony of Green and Orange
#Market and Competitor Analysis #Diagram #Graph
-

Competitor Product Analysis and Competitive Advantage Bar Chart – Market Share Comparison
#Market and Competitor Analysis #Graph #Competitor Analysis
-

Gender Ratio Bar Graph – Market and Competitor Analysis
#Market and Competitor Analysis #Graph #Competitor Analysis
-

Business Bi-level Bar Graph – Optimized for Competitor Analysis
#Market and Competitor Analysis #Graph #Competitor Analysis
