Orange Hexagon Template World Map – Market Analysis Insights
RJ0200038_13
- Last Update 04/08/2025
- File Size 1.1MB
- # of Slides 2
- File Format PPTX
- Slide Ratio 16:9
- Color
Keywords
- #Content-Based Slides
- #Design-Based Slides
- #Market and Competitor Analysis
- #Graph
- #Other
- #Market Share
- #Target Market
- #Circles
- #Doughnut Chart
- #Map
- #16:9
- #world map PowerPoint slide
- #global market analysis presentation
- #geographic location markers slide
- #world map template download
- #international business PowerPoint
About the Product
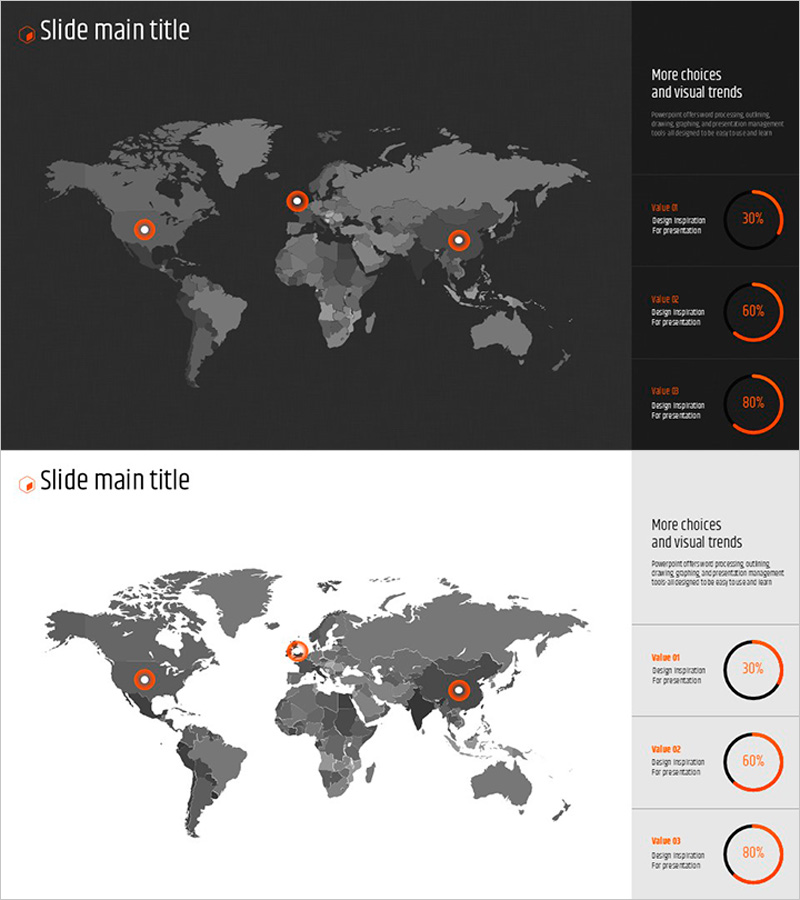
A professional world map PowerPoint slide designed for global market analysis and regional strategy visualization. The slide features a dark gray world map with three orange circular pin markers highlighting key geographic locations, complemented by three donut progress charts on the right side displaying regional performance metrics. Available in 16:9 widescreen format with 2 slide layouts, this presentation template is ready for international business pitches, competitive analysis, and global network presentations. All elements including map markers, chart values, and labels are fully editable for customization.
Usage Points
-
Main Usage
Communicate global business strategy and regional market performance at a glance using map-based visualization. Pin markers highlight key business hubs or competitive positions, while donut charts on the right quantify regional metrics such as market share, revenue, or goal achievement, making it ideal for executive and investor presentations.
-
How to Use
Click on the three pin markers on the world map to reposition them according to your business locations, competitor positions, or target markets. Edit the donut chart values and labels to reflect actual regional data such as sales figures, market share percentages, or growth rates. Add or remove pin markers as needed and adjust colors and sizes to match your brand guidelines.
-
Recommended For
Global business strategy presentations, international marketing plans, competitive analysis reports, investor pitch decks, overseas branch introductions, and multinational project updates. Ideal for C-suite executives, marketing teams, and strategic planning departments presenting region-specific or country-specific data.
-
Slide Structure
Slide 1: Dark gray world map background with three orange circular pin markers positioned at key locations, accompanied by three donut progress charts on the right (30%, 60%, 80% values). Slide 2: Identical layout with light gray background. All shapes, text, and numerical values are fully editable with adjustable colors, sizes, and positions.
Related Products
-

Target Country Market Share Analysis Graph
#Market and Competitor Analysis #Graph #Other
-

Donut Chart in Overseas Markets – Market Share Analysis
#Market and Competitor Analysis #Graph #Other
-

Visualizing South Korea's Market Share – Data-Driven Insights
#Company Introduction #Market and Competitor Analysis #Graph
-

Target Area Status Analysis Graph – Data and Insights
#Company Introduction #Market and Competitor Analysis #Graph
