Donut Chart in Overseas Markets – Market Share Analysis
RJ0900022_17
- Last Update 08/22/2025
- File Size 0.9MB
- # of Slides 2
- File Format PPTX
- Slide Ratio 16:9
- Color
Keywords
- #Content-Based Slides
- #Design-Based Slides
- #Market and Competitor Analysis
- #Graph
- #Other
- #Market Share
- #Target Market
- #Circles
- #Doughnut Chart
- #Map
- #16:9
- #Europe map PowerPoint slide
- #circular chart template
- #regional data visualization
- #donut chart presentation
- #market share slide
- #geographic data PPT
- #world map slide design
About the Product
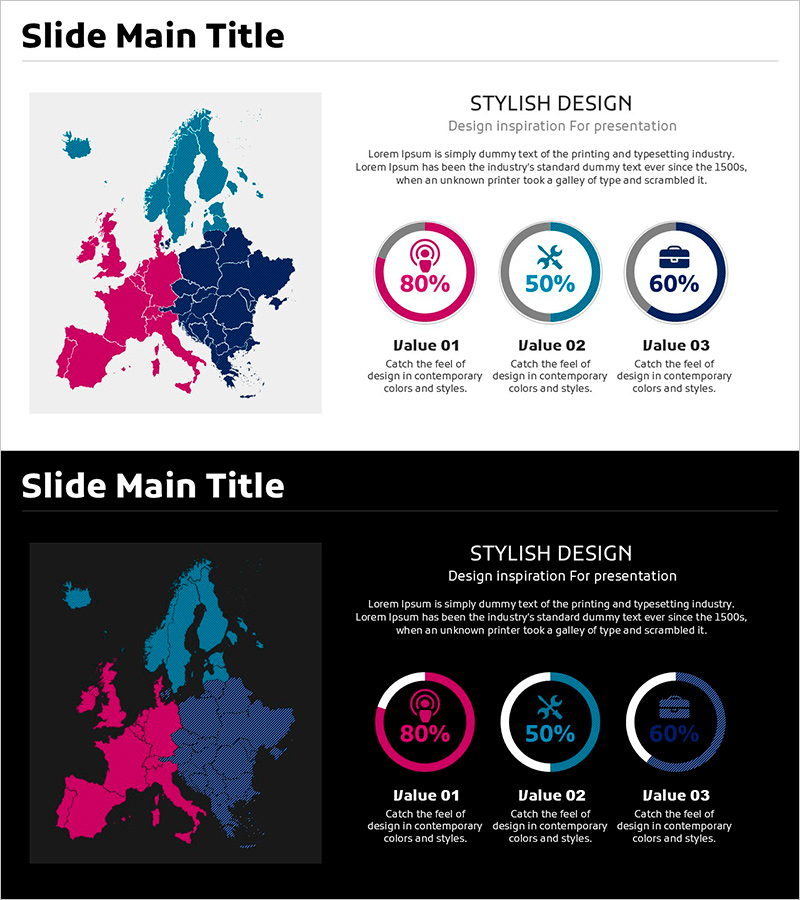
A PowerPoint slide that visualizes regional market share, sales volume, and performance data across Europe using both a geographic map and circular charts. The left side features a detailed Europe map color-coded in magenta, cyan, and navy blue to distinguish regions, while the right side displays three donut charts showing regional percentages (80%, 50%, 60%) with corresponding icons. This 16:9 widescreen slide deck includes two versions—light and dark backgrounds—making it ideal for international market analysis, regional performance reports, and global business presentations. All elements are fully editable and ready for immediate use.
Usage Points
-
Main Usage
Display regional market share, sales distribution, and performance metrics across Europe in a single, comprehensive view. The color-coded map clearly distinguishes regions while the donut charts quantify data for each area, enhancing data credibility and audience comprehension.
-
How to Use
Use this slide when presenting international market expansion strategies, regional sales reports, or global business performance. Highlight specific regions on the map while explaining corresponding data points from the donut charts to create a cohesive narrative that resonates with your audience.
-
Recommended For
International marketing teams, global sales representatives, regional performance analysts, executives overseeing overseas operations, management consulting firms, import-export companies, and multinational corporations requiring geographic data visualization.
-
Slide Structure
Slide 1: Light gray background with Europe map on the left (magenta, cyan, navy blue regions) and three donut charts on the right (80%, 50%, 60% with icons). Slide 2: Identical layout with dark background (black). Total 2 slides, 16:9 widescreen format, PPTX file.
Related Products
-

Orange Hexagon Template World Map – Market Analysis Insights
#Market and Competitor Analysis #Graph #Other
-

Target Country Market Share Analysis Graph
#Market and Competitor Analysis #Graph #Other
-

Global Food Distribution Map – Insight into the Market
#Company Introduction #Market and Competitor Analysis #Graph
-

Green Orange Market Share Visualization – Data-Driven Insights
#Market and Competitor Analysis #Graph #Other
