Sailing Travel Market Status Vertical Bar Chart
RJ0600072_5
- Last Update 07/09/2025
- File Size 2.2MB
- # of Slides 2
- File Format PPTX
- Slide Ratio 16:9
- Color
Keywords
- #Content-Based Slides
- #Design-Based Slides
- #Company Introduction
- #Market and Competitor Analysis
- #Graph
- #Key Achievements
- #Market Status
- #Column
- #Column Chart
- #16:9
- #vertical bar chart PowerPoint
- #sailing travel market status presentation
- #column chart slide template
- #data comparison graph PPT
- #market analysis PowerPoint slide
About the Product
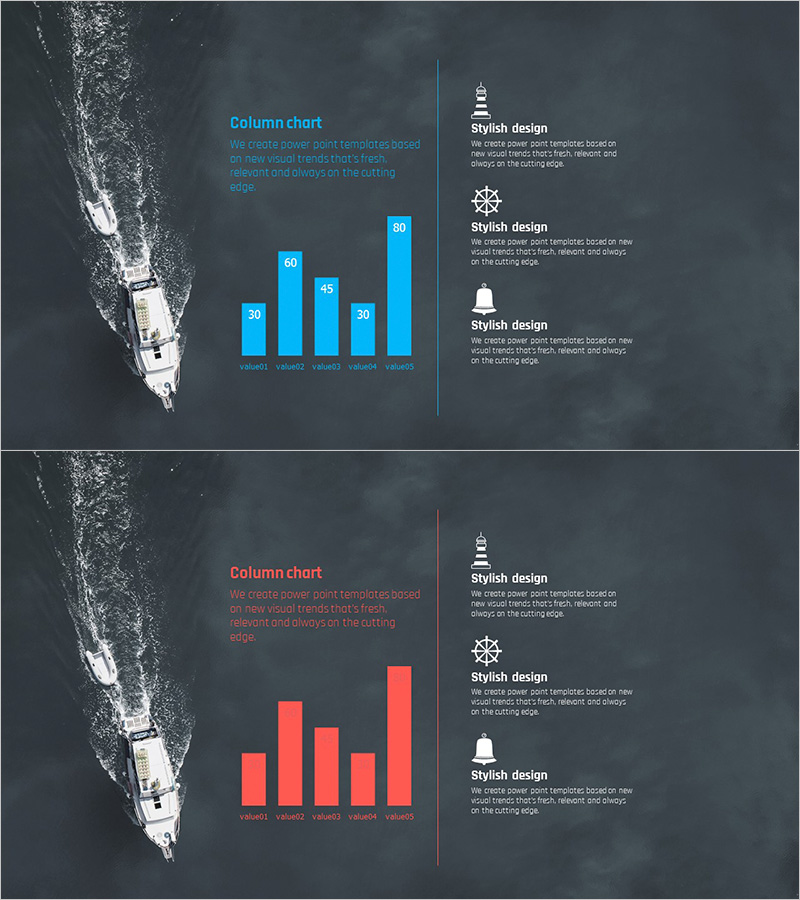
A vertical bar chart PowerPoint slide designed to analyze the sailing and travel industry market status. The slide features a dark background with blue and red color schemes representing five comparative data items, clearly visualizing numerical trends. Each slide includes descriptive text and a right-side style guide section with icons, complemented by a maritime background image that emphasizes professionalism in the travel and tourism sector. Provided in editable PPTX format, this slide is ideal for market analysis presentations, business reports, and investment pitch decks.
Usage Points
-
Main Usage
This slide visualizes numerical market data for the travel, tourism, and maritime industries using a vertical bar chart format. The dual-color scheme (blue and red) distinguishes between different data series, making it ideal for comparative analysis across years, regions, or product categories.
-
How to Use
Use this slide in business reports, investor pitch decks, and marketing strategy presentations within the market analysis section. Replace the chart values and legend with your own data, and add insights or explanations in the right-side style guide section to customize the slide for your specific presentation needs.
-
Recommended For
Recommended for travel agencies, airlines, cruise companies, tourism boards, market researchers, executives preparing business reports, and presenters at investor meetings. Particularly effective when communicating sailing and maritime tourism market trends to stakeholders.
-
Slide Structure
Two-slide set with consistent layout: left side features a maritime background image, center displays a 5-item vertical bar chart (value1 through value5), and right side contains three style guide sections with icons and descriptive text. First slide uses blue color palette; second slide uses red palette, allowing flexible color variation for the same data presentation.
Related Products
-

Beaker Shaped Vertical Bar Graph – Visualization for Market Analysis
#Market and Competitor Analysis #Graph #Market Status
-

Basic Vertical Bar Chart Slide – Market Status Analysis
#Market and Competitor Analysis #Financial Plans and Performance #Graph
-

Sailing Travel Business Market Status Vertical Bar Chart
#Market and Competitor Analysis #Graph #Market Status
-

Bar Chart for Portion of Meals – Visualizing Market Status
#Market and Competitor Analysis #Graph #Market Status
