Sailing Travel Business Market Status Vertical Bar Chart
RJ0600072_20
- Last Update 07/09/2025
- File Size 1.3MB
- # of Slides 2
- File Format PPTX
- Slide Ratio 16:9
- Color
Keywords
About the Product
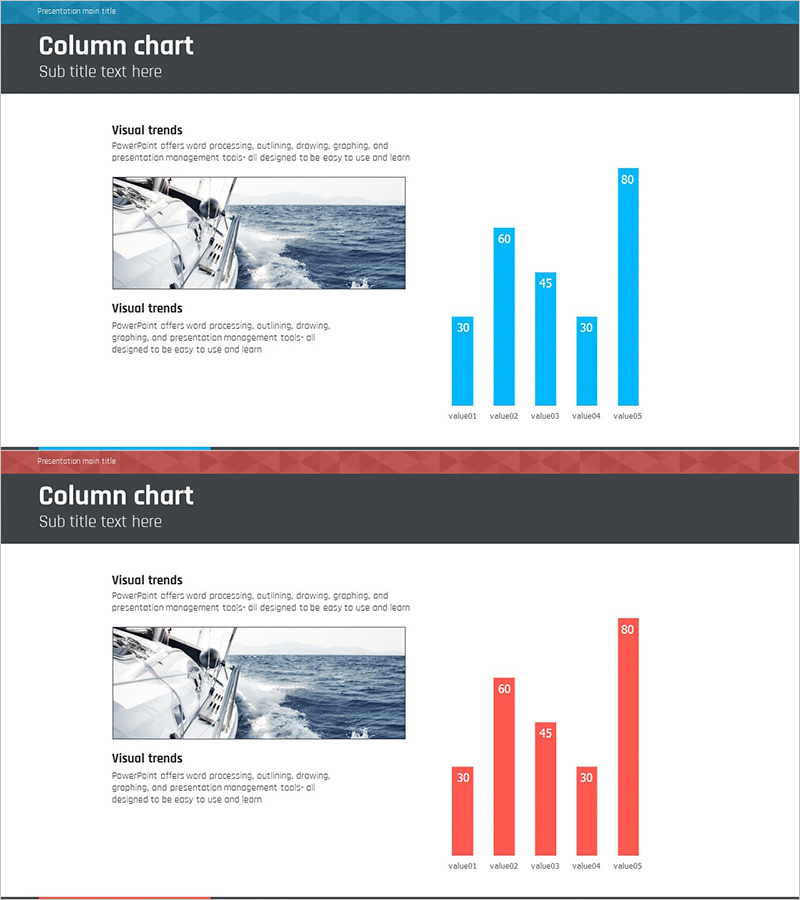
A vertical bar chart PowerPoint slide designed to compare and analyze market status across five items in the sailing, travel, and business sectors. The slide features two color schemes—cyan and red—allowing different data visualization approaches on each slide. Clear numerical labels enable immediate use in presentations, while the left-side image area provides contextual visual support. The 2-slide set is optimized for comparative analysis and trend explanation in business presentations and reports.
Usage Points
-
Main Usage
Clearly compare and analyze numerical data across five categories such as market status, sales performance, customer satisfaction, or competitor benchmarking. The vertical bar format allows viewers to instantly grasp relative values, making it ideal for data sections in reports, proposals, and business plans.
-
How to Use
Insert relevant images in the left image area and replace the graph values with your actual data. Use the cyan tone for positive indicators and red tone for cautionary metrics. Add analytical text in the description area below to complete the slide.
-
Recommended For
Marketing professionals, business planners, financial analysts, and consultants presenting market research results, sales performance, or management metrics. Particularly suitable for industry reports and investor presentations in sailing, travel, and business sectors.
-
Slide Structure
2-slide set. Each slide contains a header section (title and subtitle), left image area (approximately 4:3 aspect ratio), right vertical bar graph (5 items with values ranging 0–90), and bottom text description area for analysis.
Related Products
-

Weather Change Vertical Bar Graph Analysis - Understanding Market Status
#Market and Competitor Analysis #Graph #Market Status
-

Real Estate Sales and Consumer Analysis Slide
#Market and Competitor Analysis #Graph #Market Status
-

Column Chart for PowerPoint – Visualization of Market Analysis and Performance
#Market and Competitor Analysis #Financial Plans and Performance #Graph
-

Business Promotion Strategy Presentation Template – Effective Visualization and Structured Approach
#Business Strategy #Market and Competitor Analysis #Graph
